

Hi community!
Today, we are very excited to share the latest updates to our Data Stories tool. Now, you can connect it with Snowflake, utilize our Data Explorer, and improved filters!
In case you're not familiar, Data Stories is our rapid data visualization tool designed to create, present, and share data-driven narratives using dynamic reports, animations, and tooltips.
So, what’s new? 👀
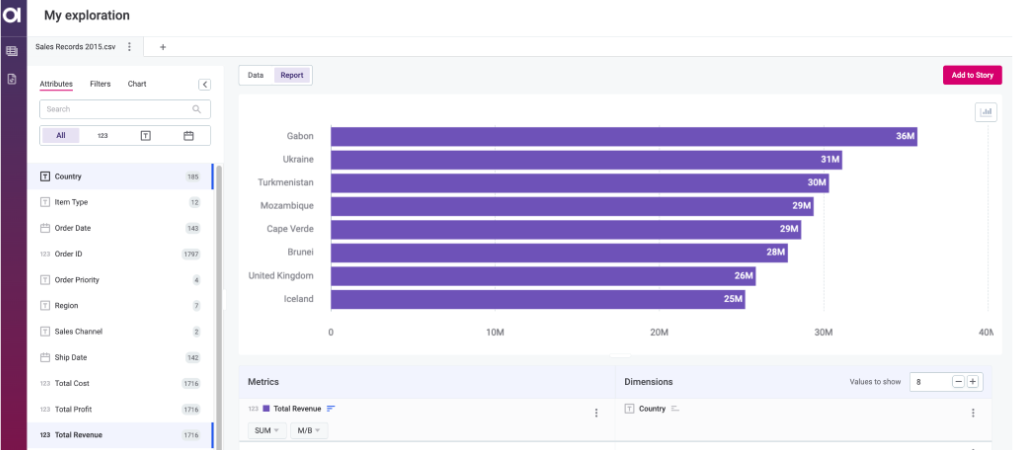
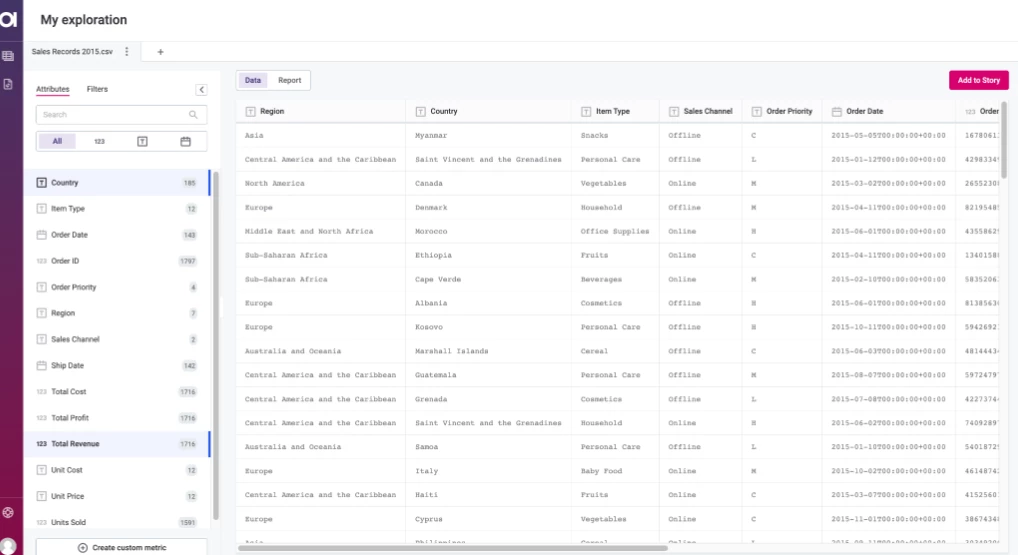
Data Explorer
We have a brand new feature - Data Explorer! Using the Data Explorer, you can perform quick data explorations and understand your data much faster but also:
-
Save explorations for reuse as answers to your data questions
-
Utilize textual annotations and overlays on data visuals
-
Explore your data and identify patterns, trends, and outliers to get insights about customer behavior, market trends, business performance, and more
Connection to Snowflake
Using our new native connector, it’s now possible to create data visualizations on your Snowflake data, without moving it anywhere. You can simply connect to your Snowflake instance directly from Data Stories, explore the data, and start creating stories and visualizations on top of it.
Improved filters
We've made several improvements to our Data Stories filters as well, including simplified selection of filtered values, a new date picker for easier date selection, and new filtering conditions.
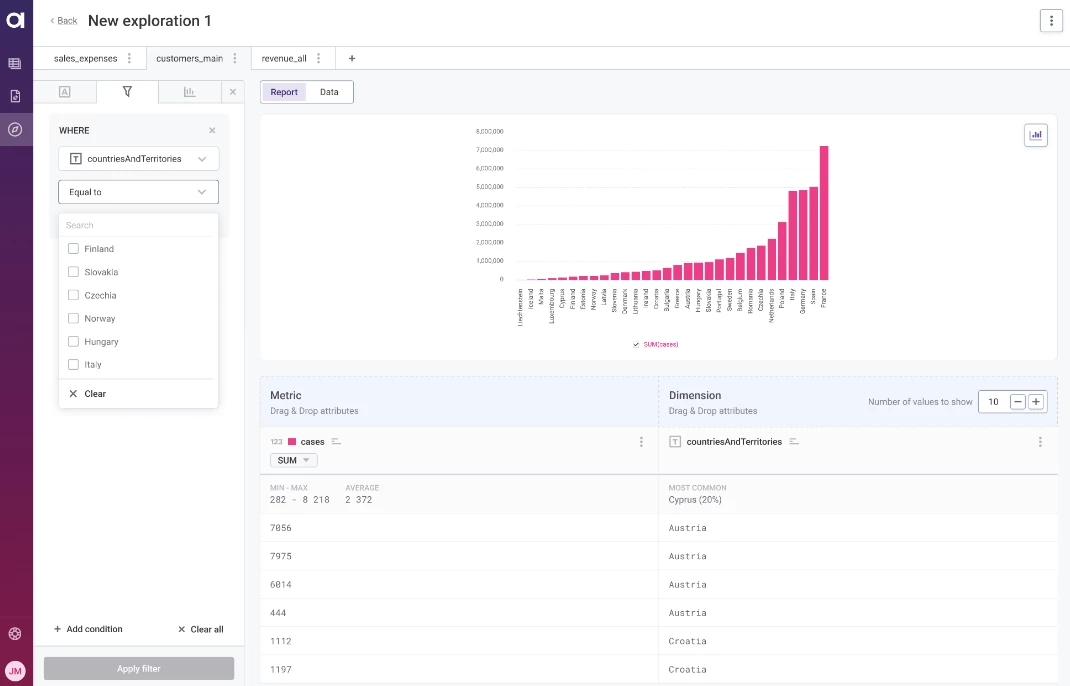
These updates will help you to focus on a specific data segment and extract meaningful insights from the data.
We hope you like our latest updates to Data Stories! Please let us know if you have any feedback or questions in the comments below👇