
Hi community 👋
In this post, find out the latest updates for Data Stories in v15.1, such as seamless navigation between Data Stories and the Knowledge Catalog for a unified experience and the enhanced Visualization Builder with condensed layouts, and new functionalities.
Now you can use Data Stories more intuitively and efficiently for data storytelling🚀
Let’s dive in!
What’s new with Data Stories?
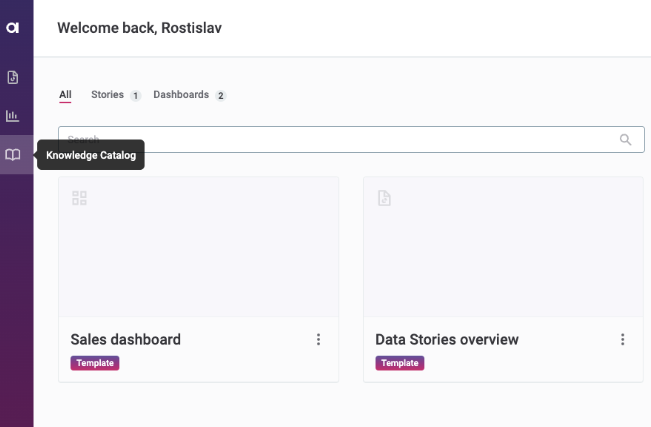
Seamless navigation to Knowledge Catalog📚
- Link to Knowledge Catalog in Data Stories navigation:
Navigate between Data Stories and the Knowledge Catalog from the was never easier with direct access to your Knowledge Catalog.
Visualization Builder 🎨
- Updated navigation and attribute list:
A more condensed layout designed to fit displays with smaller resolutions, ensuring a more efficient and visually pleasing experience.
- Enhanced data view:
Source catalog item or Data Quality (DQ) result names prominently displayed above raw data in the table, providing a clear reference to data sources.
- Ability to rearrange tabs in the Visualization Builder:
When you have multiple visualizations in your collection, it’s not always easy to find the ones you need. Now, you can organize your tabs in collections for easy management and group them by topic or visualization type.
- Ability to define segments in the KPI widget:
The KPI widget now allows you to define specific performance ranges visually, providing a clearer representation of key data points.
- Top/Bottom values feature refresh:
The formerly named Top N feature has been rebranded to Top/Bottom Values, accompanied by a refreshed UI and an information box explaining its impact on visualization results. The support was also extended to Pivot Table.
Additional Improvements
Effortless visualization copying:
Management of visualization has been made easier with the new features that allows you to copy or move a visualization from one collection to another. This feature not only saves you time but also helps you better organize your visualizations by grouping them according to your needs.
Localization support:
You can now use Data Stories in English, German, French, Italian, and Czech 🗣️ Your ONE language preference will be reflected on Data Stories and you can always change it under User Settings.
We hope that you are as excited about these upcoming enhancements as we are! They are built to make your Data Stories experience even more intuitive, efficient and tailored to your specific needs.
Stay tuned for more exciting announcements and share your thoughts on the latest Data Stories features in the comments 👇