


Export Monitoring Project Metedata + Results For Multiple Runs And Versions
Introduction
For DQ monitoring and reporting, it may be useful to extract the results of monitoring project reports into a spreadsheet, or to an external database. It may also be useful to extract multiple or all reports/runs for a monitoring project at once.
The following topic covers a component created to export results, how it can be used, and how it was created (in case modifications need to be made).
Scope of the Component
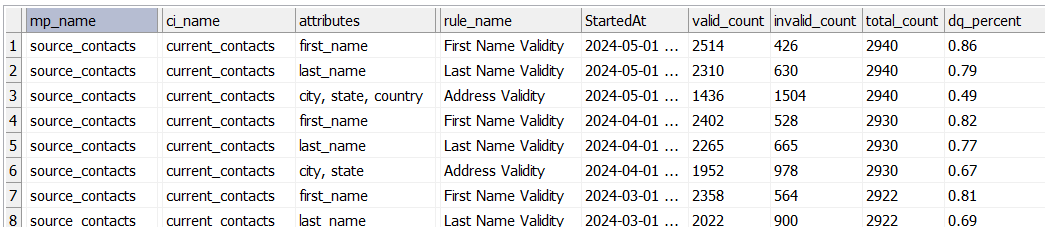
The component extracts DQ results from a monitoring project. The output is on the rule instance level, where each rule included in the monitoring project across all tables is output with its dq validity percentage, and the number of valid and invalid records for said rule. Each record is also output with a date field, to organize results by the report run date (as multiple reports may be included in one export)
Using the Component
To use the component, move the component files to a folder. The following are the required components:
- GET_DQ_SUMMARY.comp
- filter_date_range.comp
- get_dq_results.comp
- get_entity_names.comp
To use the component, include the GET_DQ_SUMMARY.comp in a plan where the output is needed (it can be simply a plan that uses the component, linked to a JDBC writer, or text file writer, if no further transformations are involved).
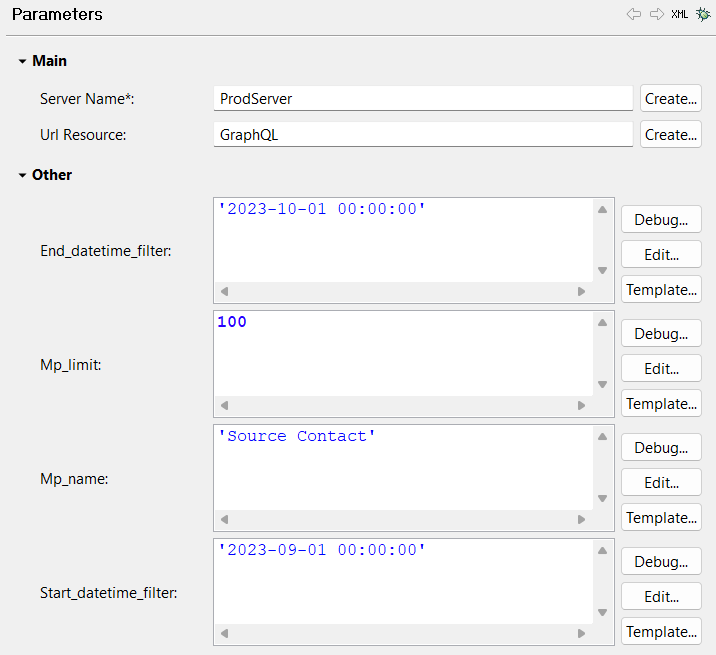
The components require the following parameters:
- Server Name: the server that you will be accessing for the monitoring project results.
- URL Resource: the url that will be used for GraphQL queries (that extract the metadata).
- mp_name: the name of the monitoring project that results will be extracted from (in quotations)
- start_datetime_filter: the start of the date range, within which monitoring project report results will be extracted.
- end_datetime_filter: the end of the date range, within which monitoring project report results will be extracted. (example '2023-10-01 00:00:00')
- mp_limit: the limit of monitoring projects reports to extract results for.
Component Logic
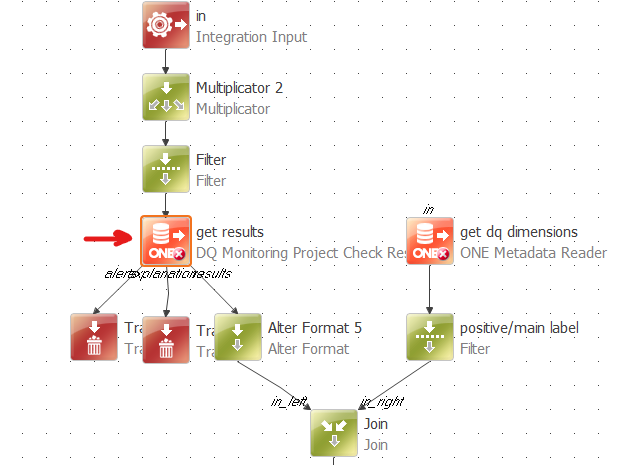
The component exports the monitoring project results in two steps. The first step exports the metadata of the monitoring project (and any changes between the start and end datetime filter). This is done with a JSON Call.
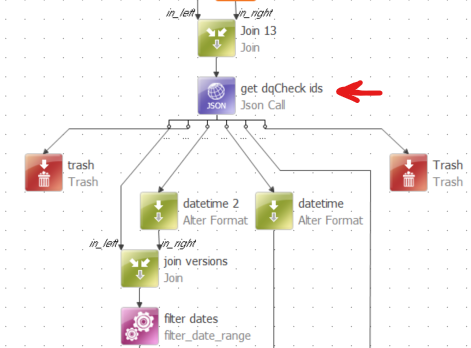
The second main step is the export of the dq results, which is done in the get_dq_results component with the “get results” step (DQ Monitoring Project Check Results step). These results are then joined back to the metadata using the dq_check_id as a key (the id for each individual rule assigned to a monitoring project).
The filter_date_range component filters the metadata of the monitoring project to only include versions applicable to the date range. And the get_entity_names component links the ids retrieved from the JSON call metadata export to their respective names (including the catalog item, attribute and rule names).
Trouble Shooting
Note, if the plan isn’t running properly, try checking the following:
- If the plan is failing and claiming a server or URL resource is missing, ensure the fields for the servers within all the steps are either populated with the server names, or parameterized (as they are by default) to be passed outside of the component.
- If no monitoring project results are showing up, check the mp_limit, and make sure that that number of monitoring project runs are successful runs. Failed runs will be included in this count, and will return no records.