
Hi Community!
We are back with our ONE Desktop best practice series and today, we have a lengthy but important one. How to work with Data files? Let’s get into it.
Navigating the Data File Maze
First things first, let's tackle the basics of working with data files.
Getting Started
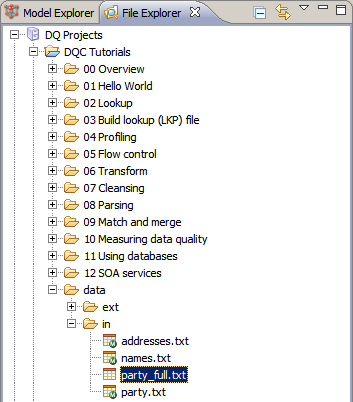
You can use existing files as input data for your plans. There are two primary ways to add files: by dragging and dropping them from your file system into the desired project in the Navigator panel or by copying them from the destination folder to the relevant project folder inside your workspace directory on your file system.
Unlocking Data Files
To open a data file, simply locate it in File or Model Explorer and give it a double-click. If it's your first time opening a data file (you'll notice there's no 'M' in the bottom right corner), you'll launch the Metadata Editor.
Fine-Tuning Metadata
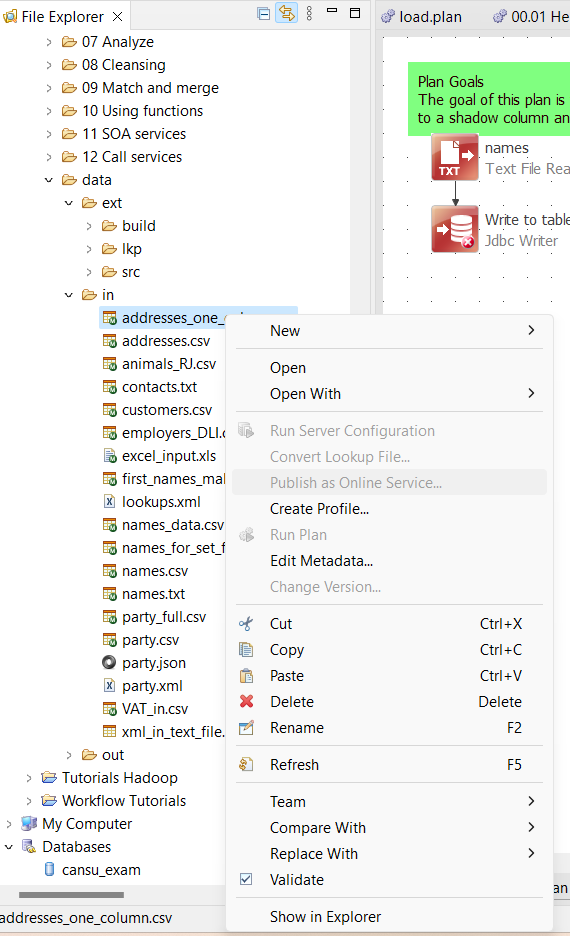
Metadata is your key to understanding and properly using data files—especially CSV, TXT, and XLS(X) formats—in your plans. To edit metadata, right-click the file and choose Edit Metadata.
In the initial Format tab, you can specify the rules for reading and interpreting your raw data. The most critical settings include:
- File type: Choose between delimited or fixed-width.
- Encoding: Specify the character encoding.
- Field Separator: Select the symbol that separates your data into columns. Relevant when using delimited File Type.
- Data starts at line: Indicate the line where your data begins, usually "2" for data with field names or "1" for data without.
- String qualifier: Define the symbol used to encapsulate string fields, protecting them as a single value. Recommended for cases where data might contain the defined delimiter, potentially disrupting the structure (e.g., data containing line or column separators).
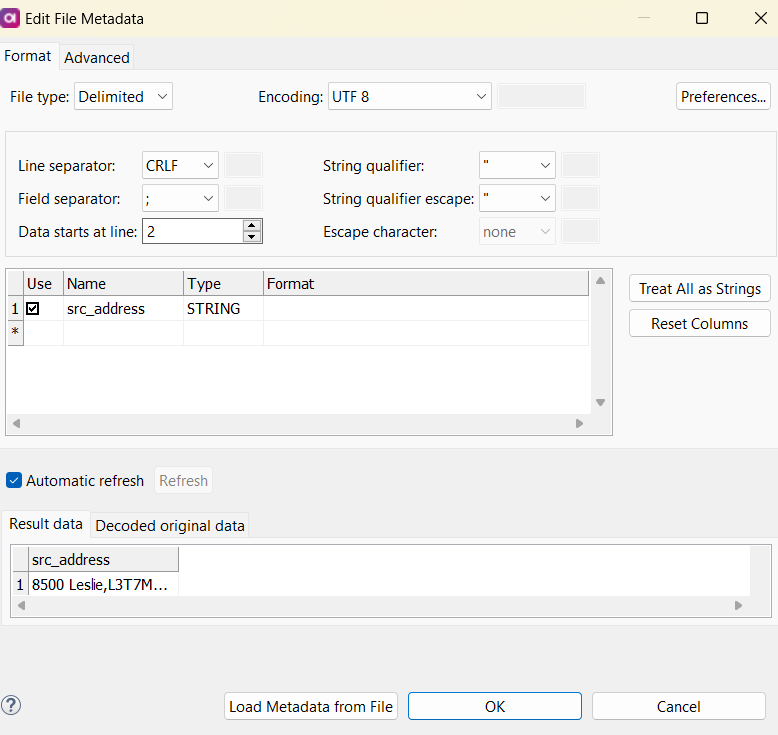
Section 2 of the Edit File Metadata dialog lets you view the columns resulting from your Section 1 specifications. You can change their data type and format where applicable. For instance, when selecting an integer or long data format, you can choose the thousands separator in the Format column.
Section 3 allows you to see the final data in the Result data tab and compare it to the original data in the Decoded original data tab.
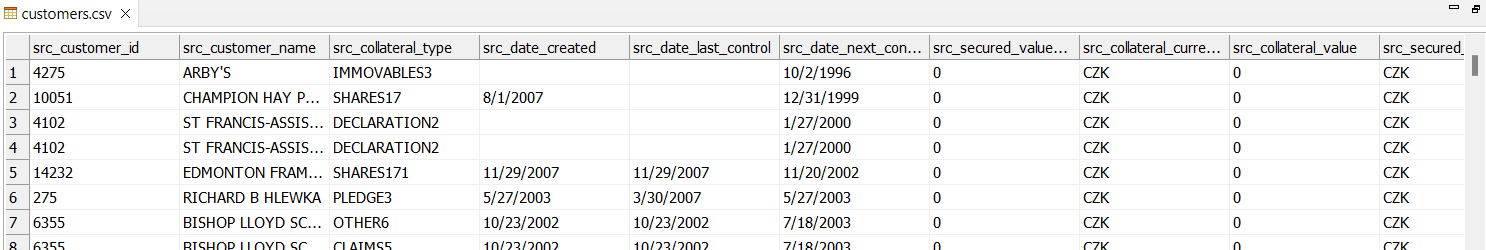
Peeking at Data Files
Double-clicking a text file opens it for viewing in the CSV Viewer. This tool displays your data in rows and columns, adhering to the file's metadata.
Taming the Data Beast
To sort a column, click on its header name. One click sorts the data in ascending order (A to Z), indicated by an up arrow. A second click reverses the sort, putting the data in descending order. A third click removes all sorting, restoring the original data order.
Filtering the Noise
To focus on specific data subsets, use the Switch View button in the toolbar:
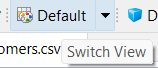
This opens the View Settings dialog, housing a tab called Filter.
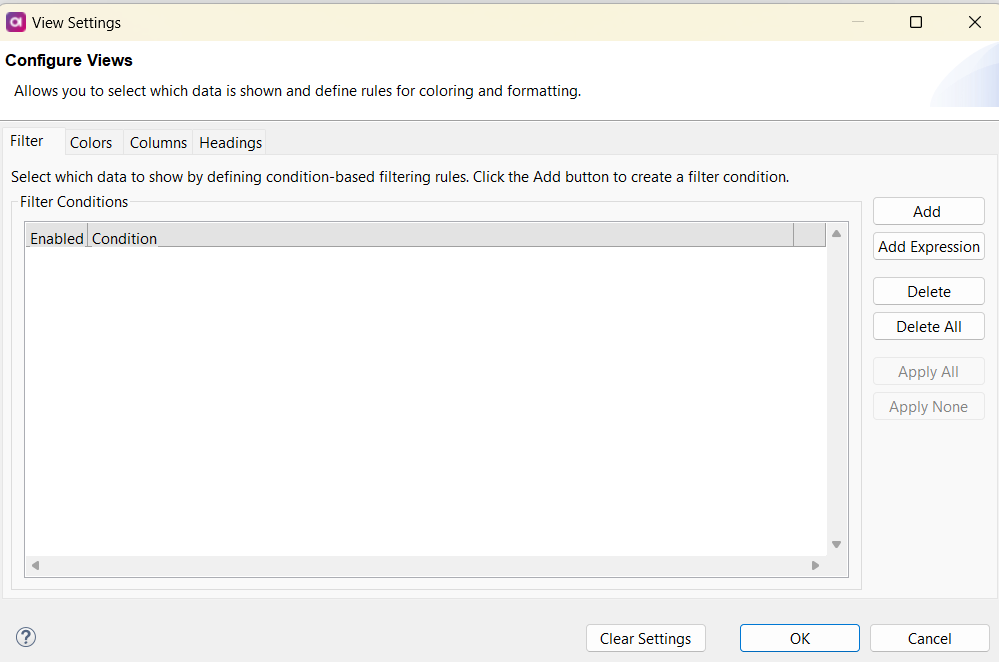
To create a filter, click Add. Use the dropdowns to select a column to filter, a condition (e.g., =, <, contains), and the matching criteria. You can specify whether the filter should be case-sensitive or not. Filters display only rows matching the criteria. Multiple filters can further refine your displayed data. To deactivate a filter without deleting it, uncheck the Enabled checkbox.
Adding a Splash of Color
While data typically appears in black text on a white background, you can apply different formatting or coloring for specific values or ranges. This aids in visually identifying key values in extensive data files. Conditions for coloring are set similarly to filters, but there are additional options for background coloring and text formatting (found in the Coloring column):
- Background: Define highlighting for cells.
- Foreground: Set the text color.
- Bold: Bolden the text.
- Italic: Italicize the text.
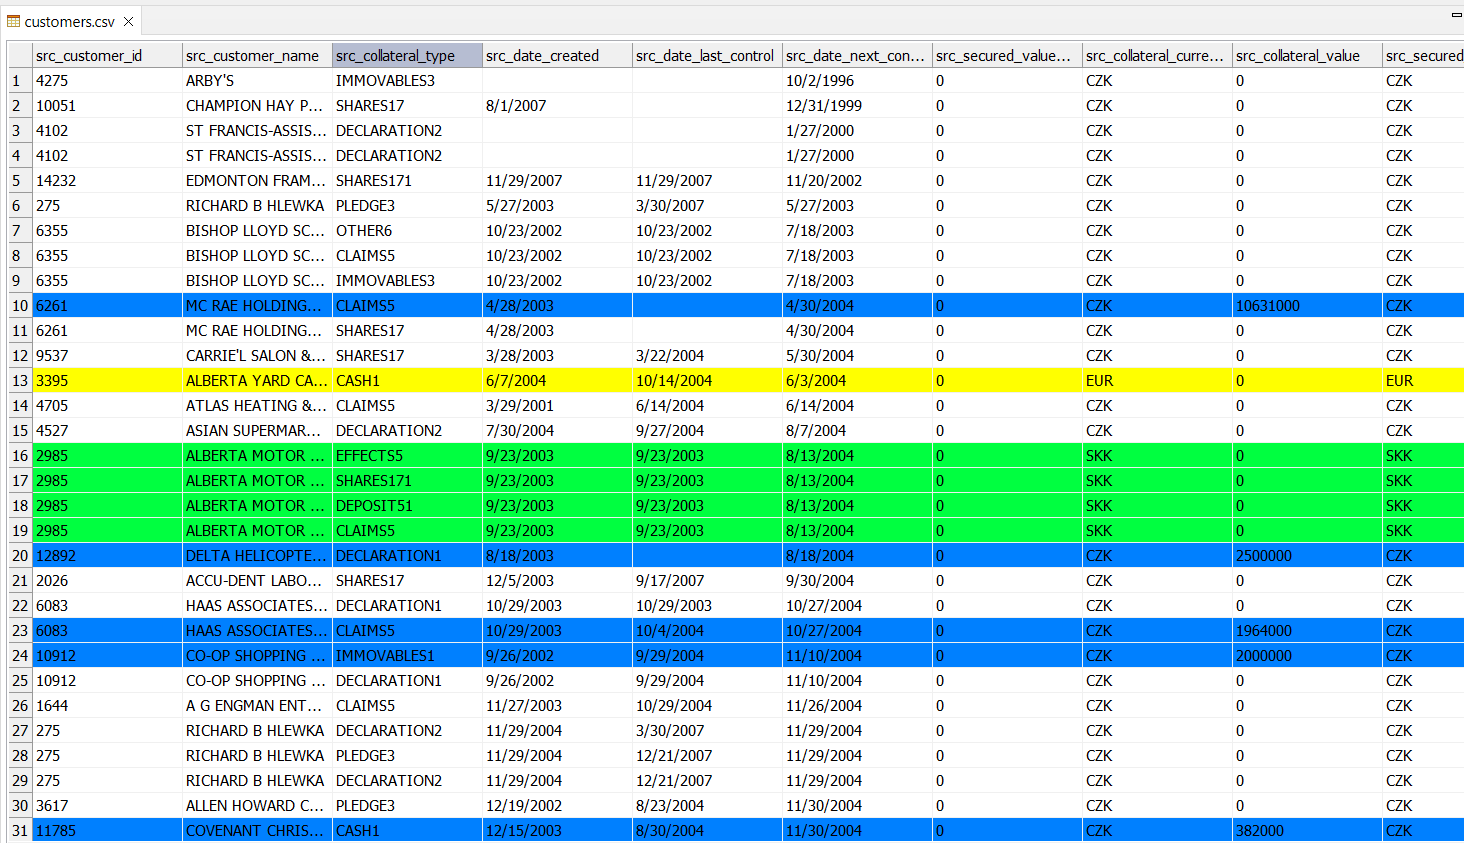
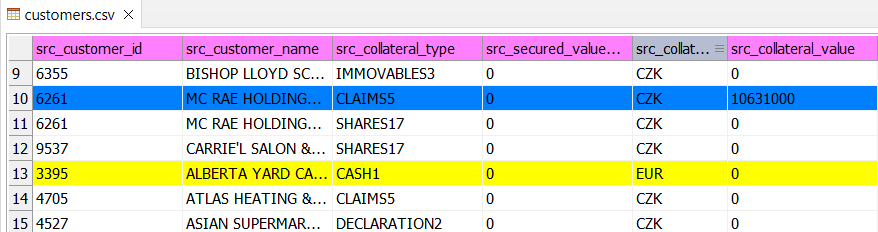
You can specify whether the coloring rule should apply to the specific cell that matches the rule or to all (or a subset) of the columns (under Apply to). After defining and applying these coloring rules, your CSV Viewer will look something like this:
Coloring rules are applied in the order they appear. The order can be changed using the buttons on the right, below the Add button.
Customizing Column Visibility
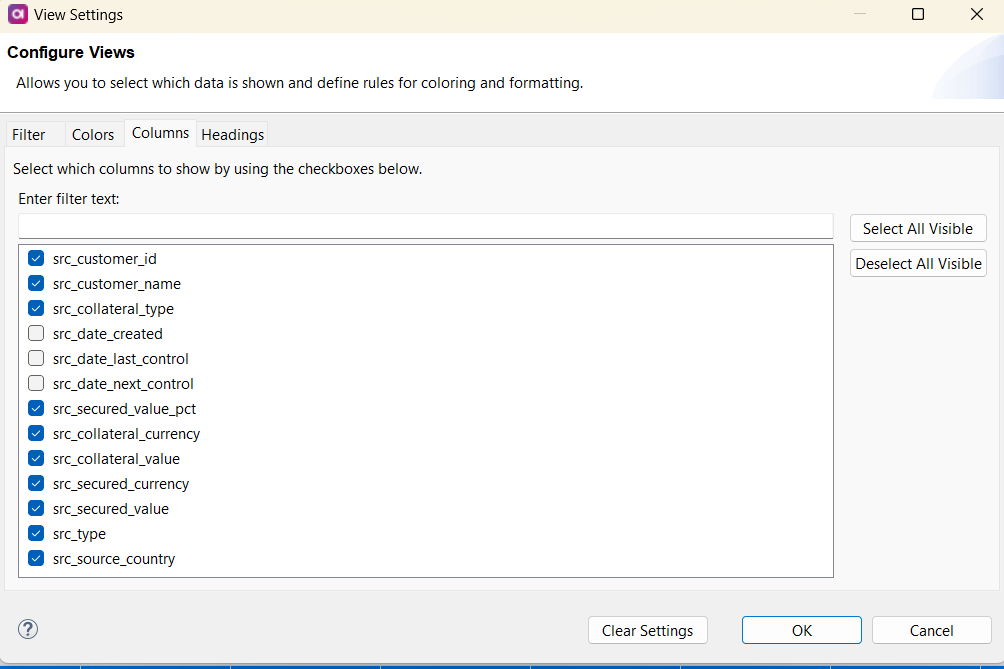
For data files with numerous columns, you can hide certain columns to focus on specific data. Go to the Columns tab of the View Settings dialog, uncheck a column to hide it, and a note appears at the bottom of the CSV Viewer indicating the number of hidden columns. A link allows you to show them all again. You can also right-click a column header and select Hide Column to hide it.
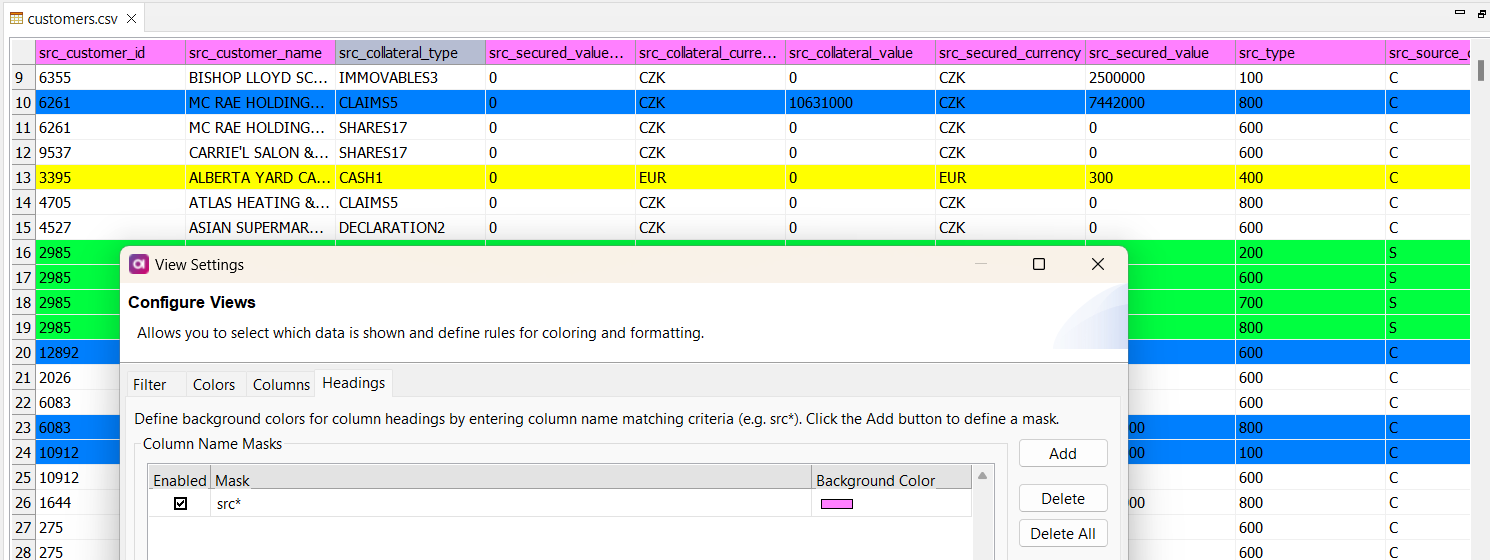
Color-Code Those Headers
To make sense of your data, you can color-code column headers based on specific naming conventions. In the Heading tab of the View Settings dialog, define a column mask (e.g., "src*") to color all headers whose names start with that text. You can set a different background color for each mask used.
Reshaping Columns
You can adjust column widths by dragging left or right over the column divider in the column header. Double-clicking the column divider auto-sizes the column to fit its contents. Right-clicking a column header provides an option to "autofit" the selected column or all columns.
Highlighting Data Groups
Another handy feature lets you visually mark changes or identify groups in your data. This is particularly useful for spotting changes in a specific column.
A column with marked groups is indicated by an icon featuring three parallel horizontal lines next to the column name.
Saving Your View
To retain your view settings, including sorting, column widths, and marked groups, use the View Settings dropdown arrow in the toolbar.
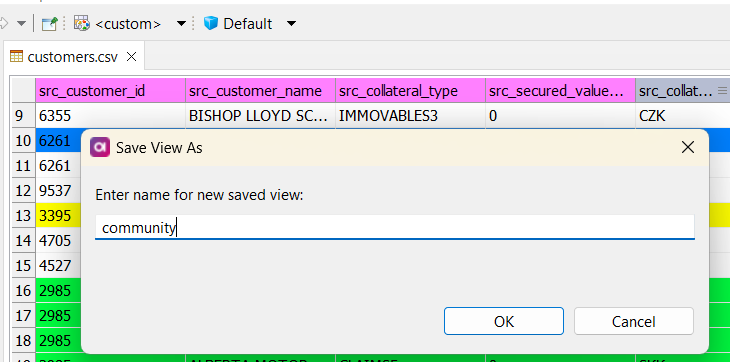
Choose Save As… to create a new saved view or Save to update an existing one. Recently used views are displayed at the top of the menu, while a complete list of saved views is found under All Saved Views. An asterisk (*) next to a view name indicates unsaved changes to the current view. To delete a view, select Manage Views. You can also import and export views for use with other copies of the product through this menu.
The "Default" view is a stored view with no settings applied. It can't be changed or deleted. When you modify the default view, the toolbar button label changes to <custom>, indicating an unsaved view based on the default view. Click Save As to name and store this new view. The Edit option is equivalent to clicking the toolbar button with the view name, opening the View Settings dialog.
Editing Data Files
In addition to viewing, you can directly edit .txt and .csv files within ONE Desktop.
To edit a data file, right-click it and select Open With > Text Editor.
The file will open as plain text (no table format) without metadata.
Alternatively, choose Open With > System Editor to open the file in your operating system's default editor.
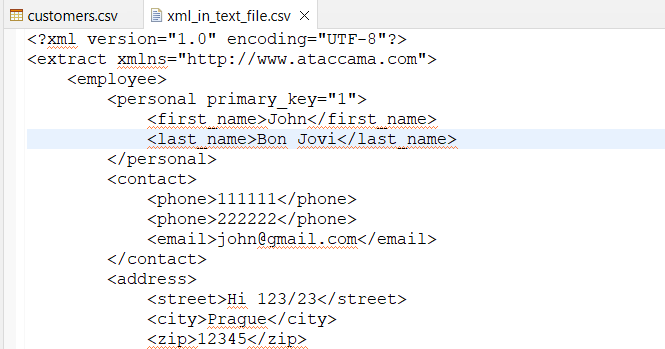
Handling XML Files
The Ataccama IDE also supports viewing and editing XML files. Double-clicking an XML file provides two views: Design (showing the XML tree structure) and Source (showing the actual XML code). XML files can serve as data sources and configuration files.
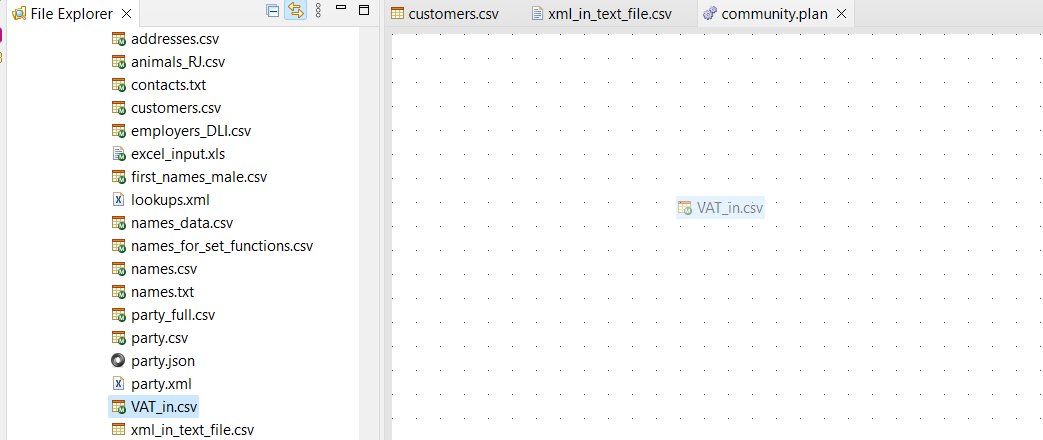
Putting Data Files to Work in a Plan
To add a data file into a plan swiftly, drag it from the explorer panel directly onto the canvas. This action generates a corresponding step, such as Text File Reader or Excel File Reader.
And that’s all for working with data files on ONE Desktop. Any thoughts, questions? Let us know in the comments 👇