


Hi Community!
Yesterday we took a step into Anomaly Detection, what is it, and how to use it. If you’ve missed that post, go check it out here:
Today, we will have a short summary of what we covered yesterday with a focus on the Data Catalog.
Spotting the Unseen: Anomaly Detection Demystified
Anomaly Detection is like having a data detective, tirelessly examining your catalog items for any unusual activities. It operates on two levels:
- Catalog Item Level: Analyzing key metrics like the number of records and summary statistics.
- Attribute Level: Delving into value distribution, standard deviation, numeric sum, and more.
Whenever a metric's value behaves abnormally, it raises a flag. But wait, there's more! Our AI-driven Anomaly Detection system, fondly known as "ONE," is a quick learner. With every confirmed or dismissed alert, it refines its understanding of your data's unique quirks. This means more precise anomaly detection with each profiling session.
Customizing Anomaly Detection to Fit Your Needs
To harness the true power of Anomaly Detection, you need to fine-tune it according to your needs. Here's how:
-
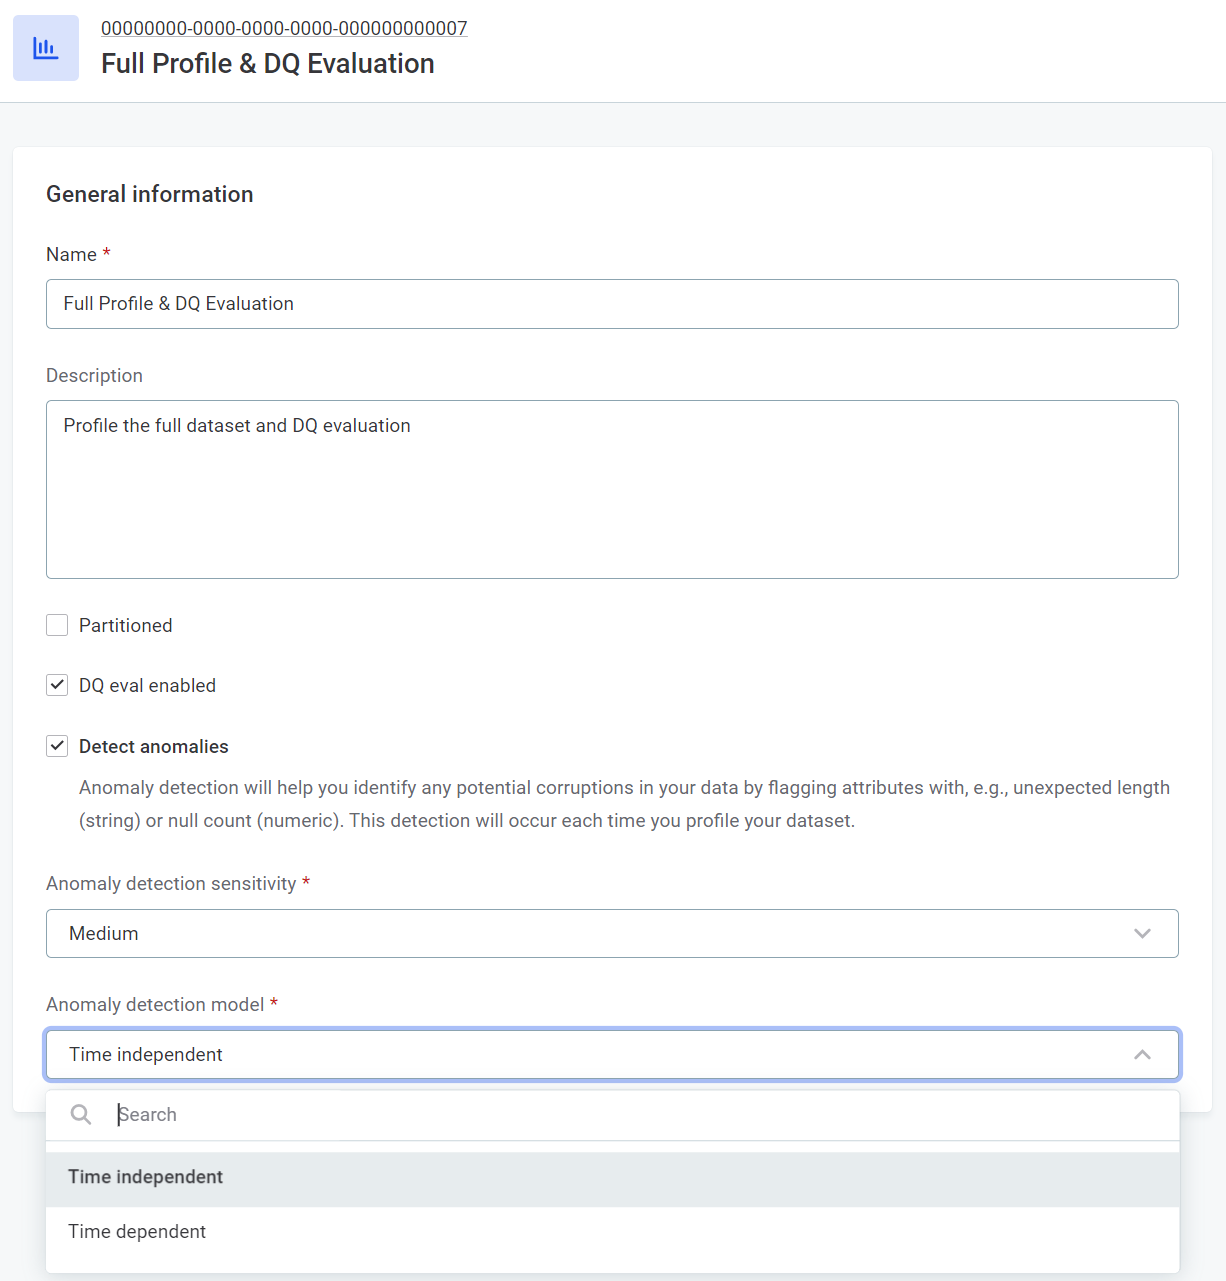
Choosing the Right Model: There are two models at your disposal – time-independent and time-dependent. The choice between them depends on your data's characteristics. Don't worry; we'll help you make the right call.
-
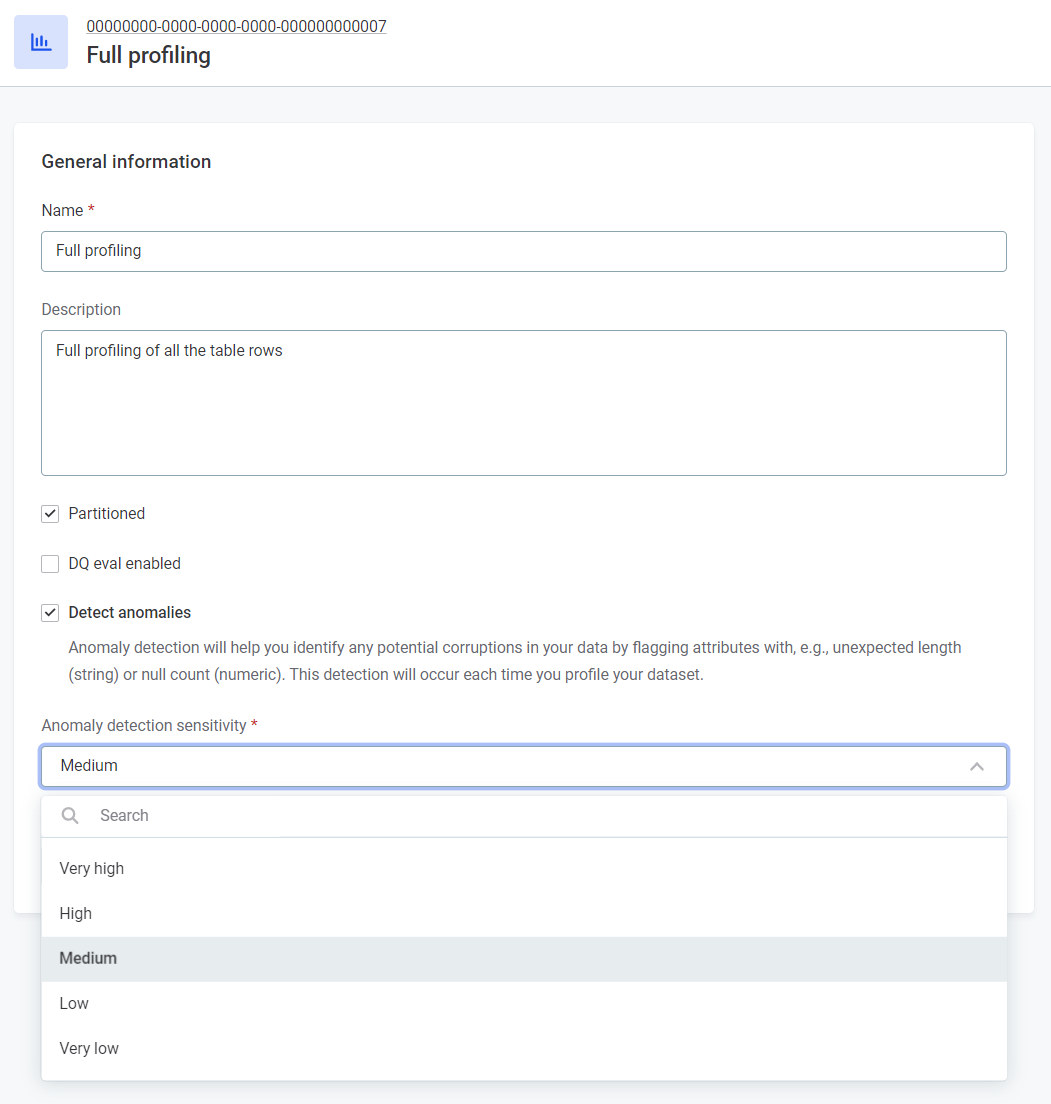
Sensitivity Settings: Think of sensitivity as the tuning knob. You can adjust it to control how far a value must deviate from the norm to be flagged as an anomaly. The sensitivity adapts as ONE learns the norms over time.
Time-Independent vs. Time-Dependent Model: What's the Difference?
It's like choosing between two superheroes – both great, but for different challenges:
-
Time-Independent Model: Works well when you're concerned about outliers regardless of time. It's your trusty companion when patterns aren't a concern.
-
Time-Dependent Model: Ideal for trends and time-based anomalies. It's the go-to when you need to capture the heartbeat of your data's rhythm.
Guiding Your Anomaly Detection Journey
Ready to set sail on this data integrity adventure? Follow these steps:
-
Model Selection: Navigate to Global Settings > Profiling, and choose between Time Independent or Time Dependent under Anomaly Detection Model.
-
Adjust Sensitivity: Determine the sensitivity level that suits your preference – Very High, High, Medium, Low, or Very Low.
-
Fine-tuning for Precision: Tailor the sensitivity based on your anomaly tolerance. Higher sensitivity catches even minor irregularities, while lower sensitivity focuses on the big anomalies.
Navigating the Anomaly Landscape
Be ready for exceptional cases:
-
Special Anomalies: Certain anomalies are detected regardless of sensitivity settings. For instance, sudden null value appearances or drastic shifts from positive to negative values.
-
Detecting Dataset Changes: Anomalies aren't just about numbers. If your dataset's growth pattern suddenly stalls or declines, that's an anomaly too!
Running Anomaly Detection Like a Pro
Ready to launch Anomaly Detection? Follow these steps:
-
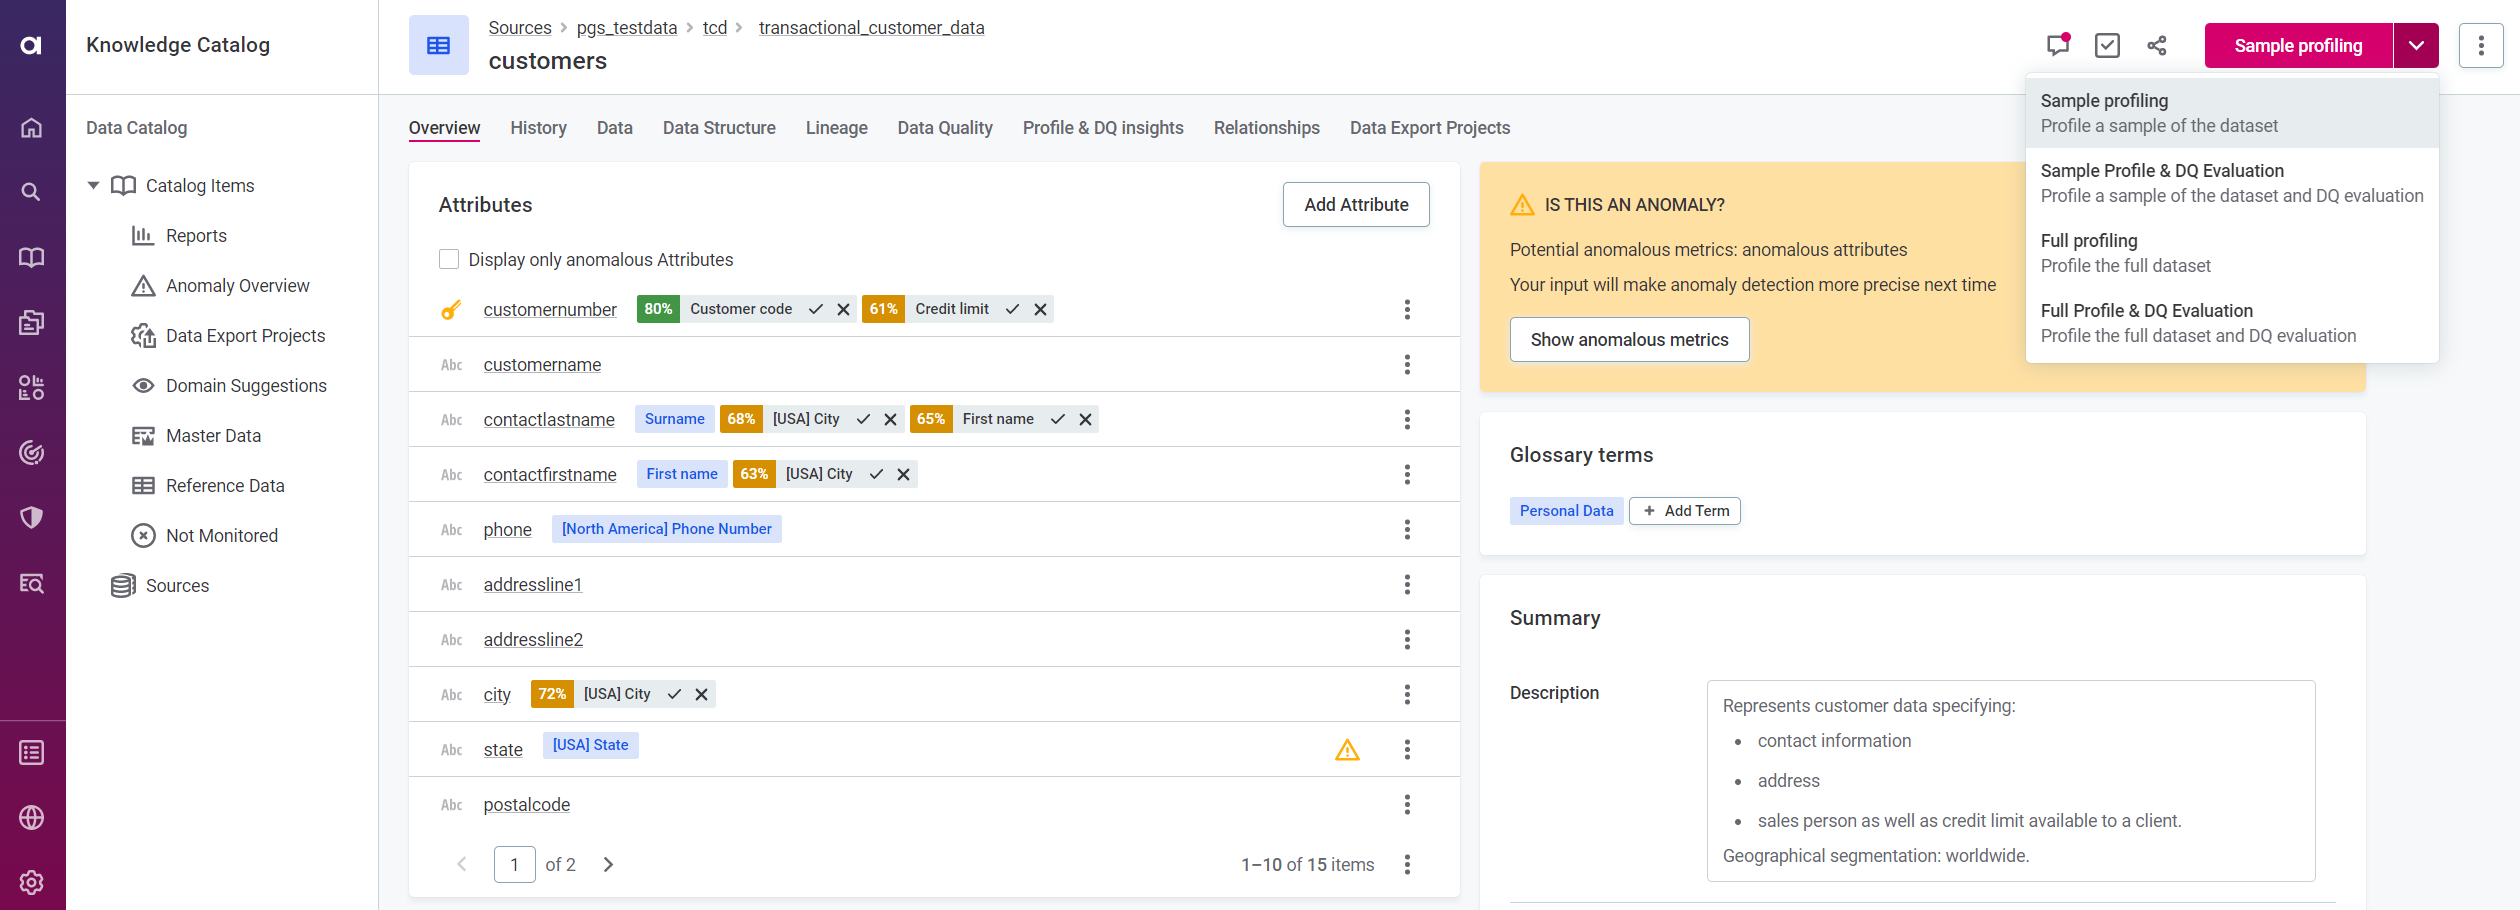
Catalog Items: In Data Catalog > Catalog Items, pick an item and opt for Full Profiling or Full Profile & DQ Evaluation from the dropdown.
-
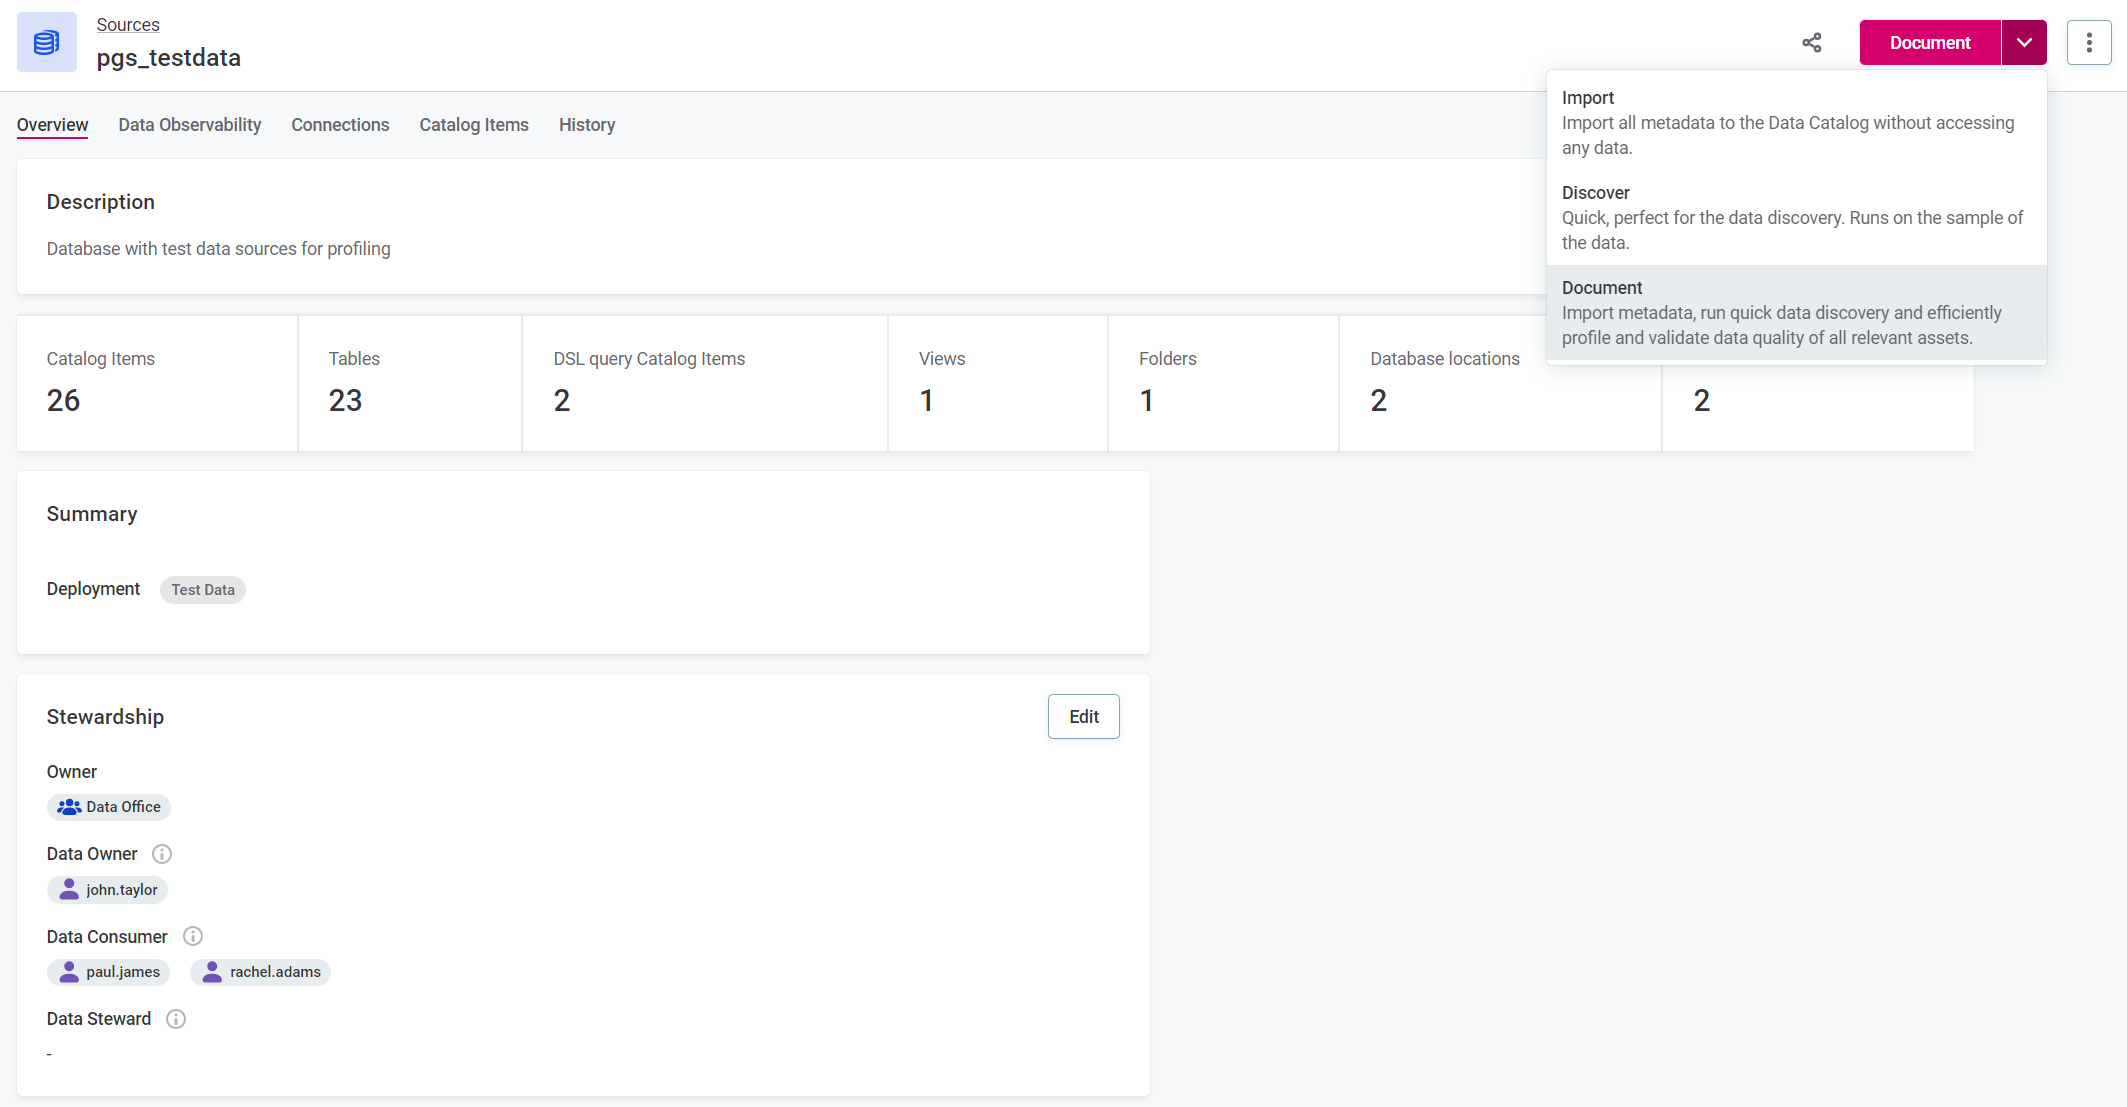
Sources: For sources, head to Data Catalog > Sources, and select Document documentation flow.
Unveiling Anomalies Like a Pro
Anomalies reveal themselves in several spots within the Data Catalog:
- Catalog item list view.
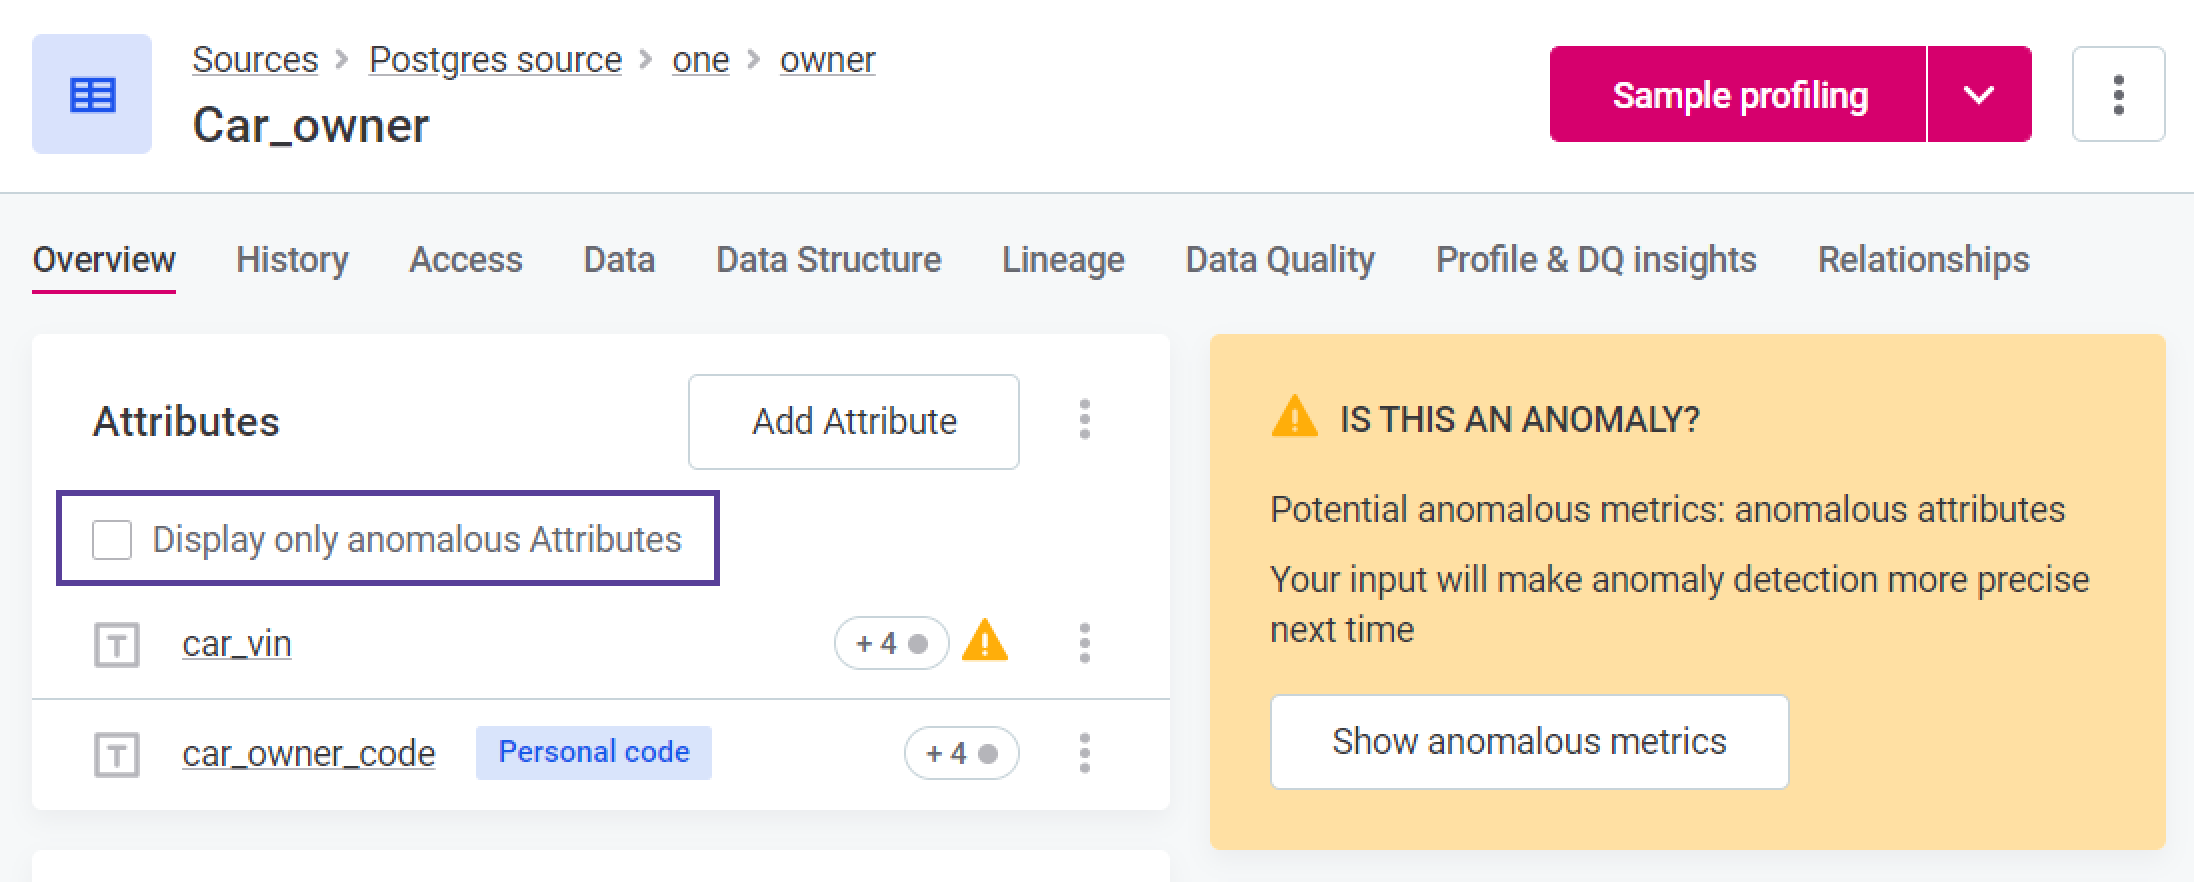
- Attribute list view within a catalog item.
- Relationship and Lineage graphs (if Show Anomalies is on).
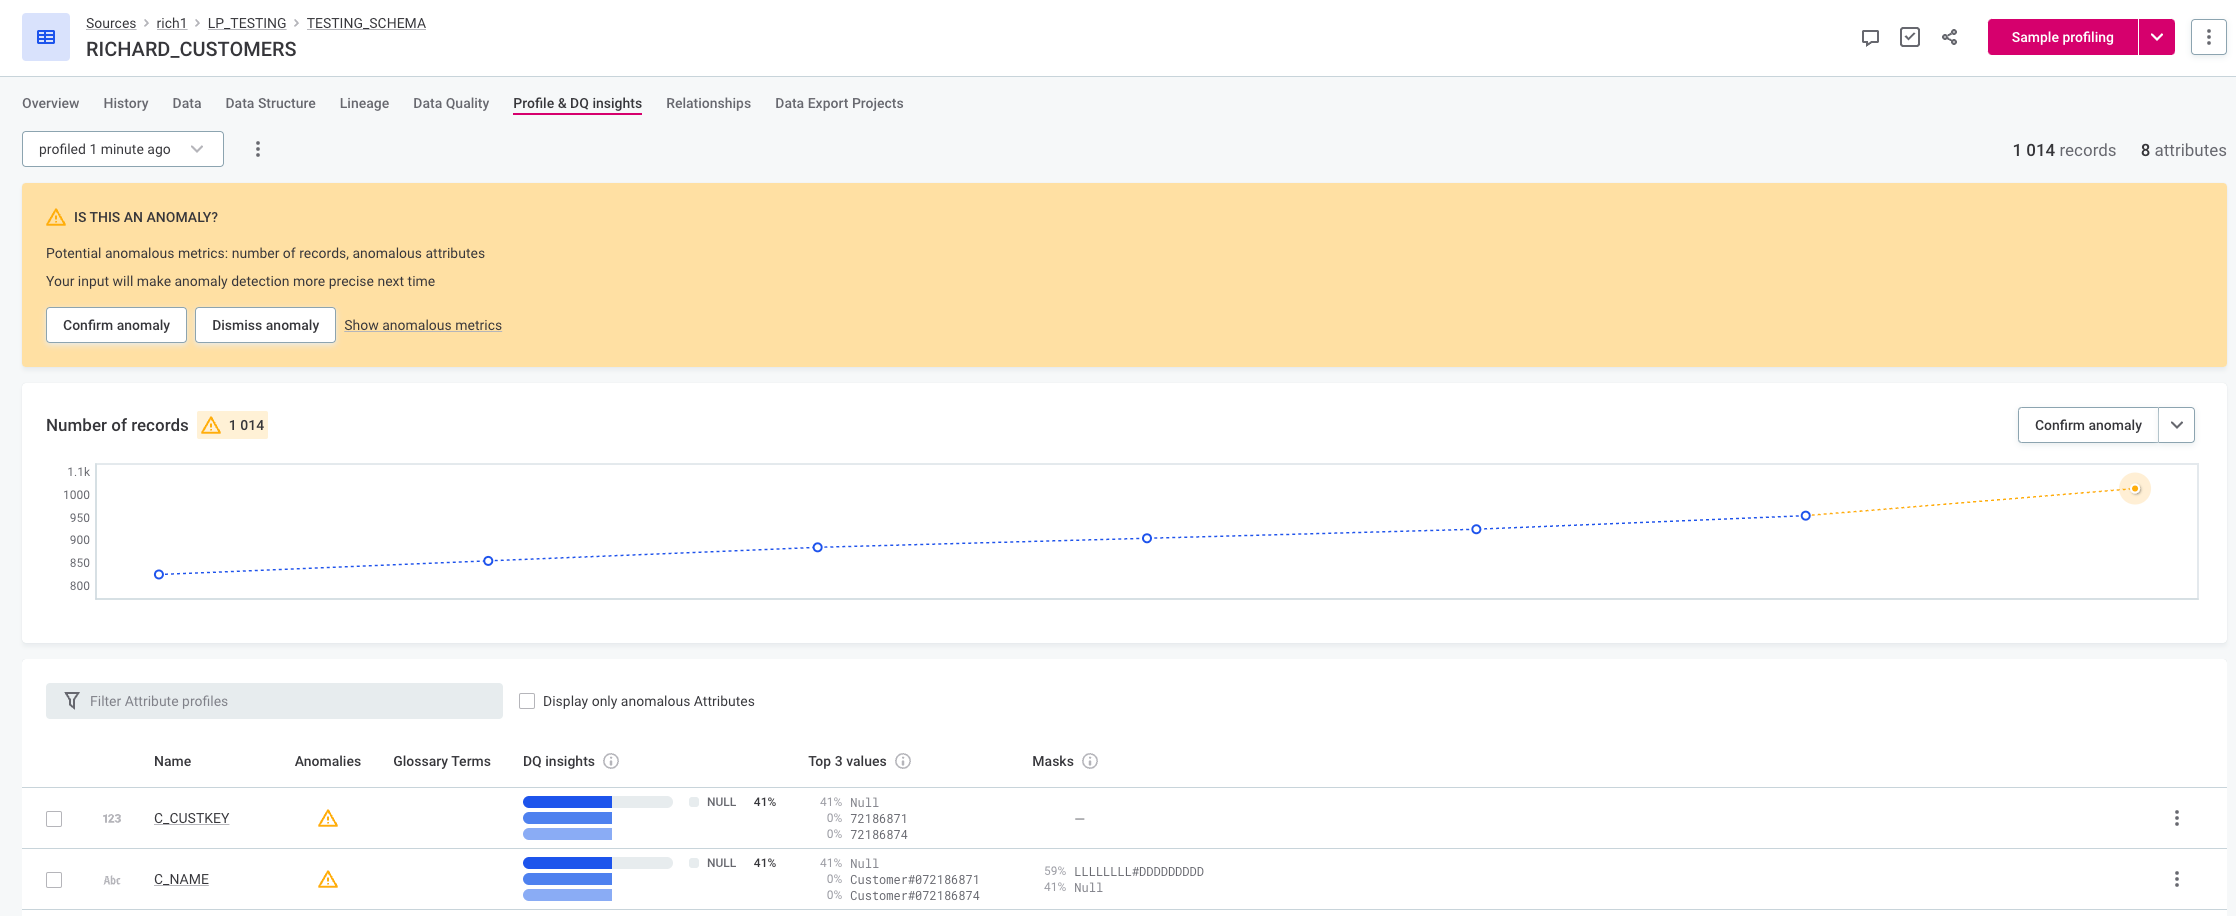
- Profile and DQ Insights tab of catalog items or attributes.
Diving Deeper into the Anomaly Insights
-
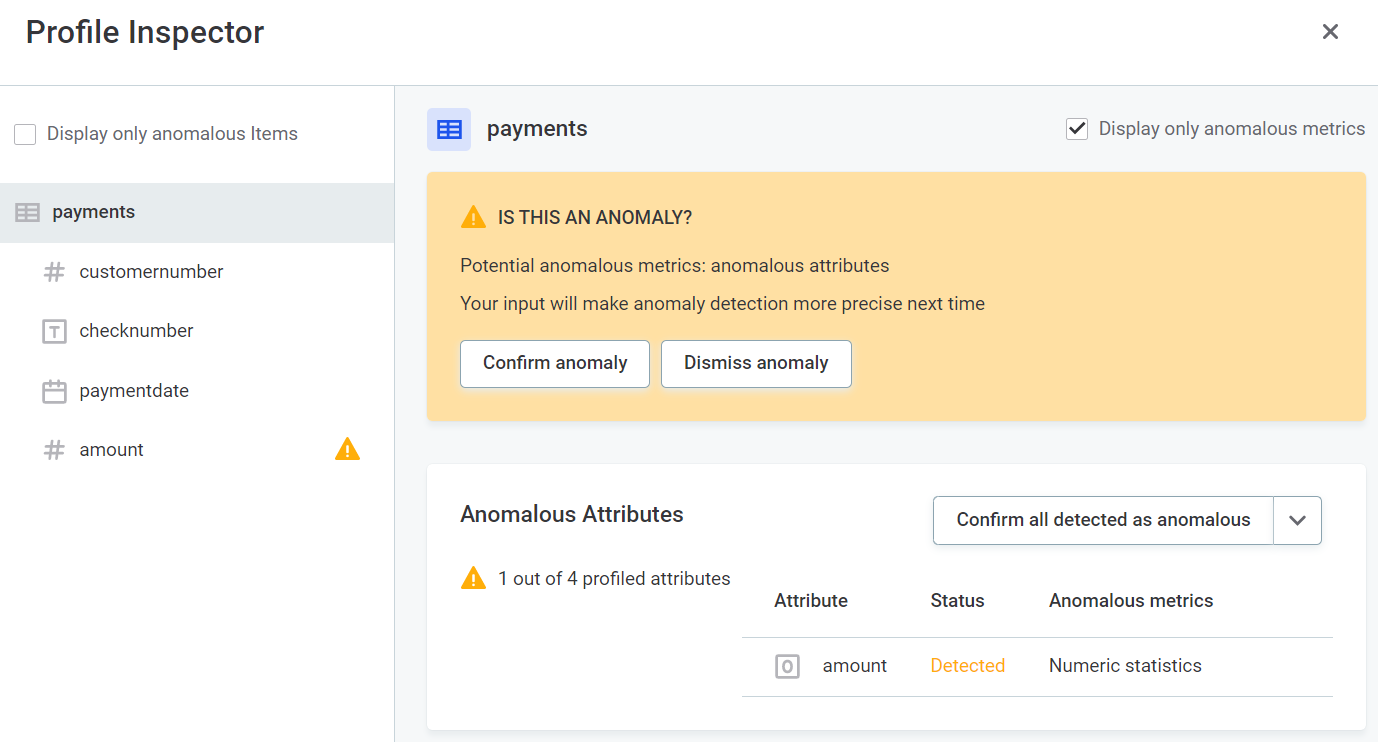
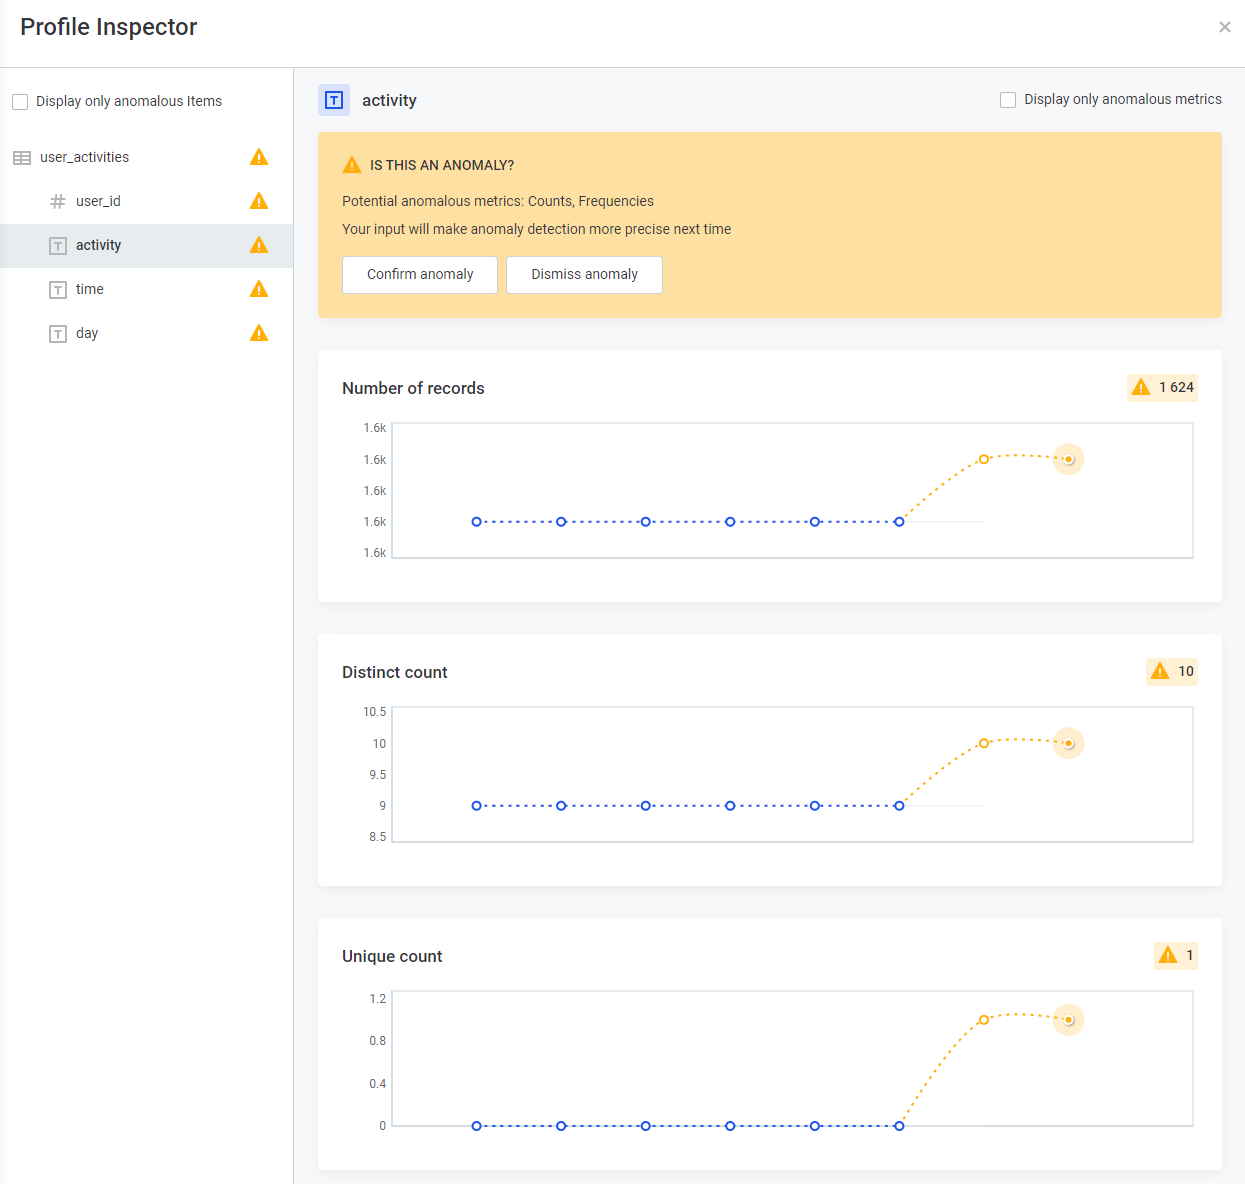
Use the Profile Inspector: Unearth insights by selecting "Show Anomalous Metrics" or simply clicking the warning icon.
-
Delve into Metrics: From the Number of Records to Variance, explore the metrics that matter.
Mastering Confirmations and Dismissals
Fine-tuning anomaly detection requires your input:
-
Confirm or Dismiss: Once anomalies are detected, you can confirm or dismiss them, shaping the system's learning process.

-
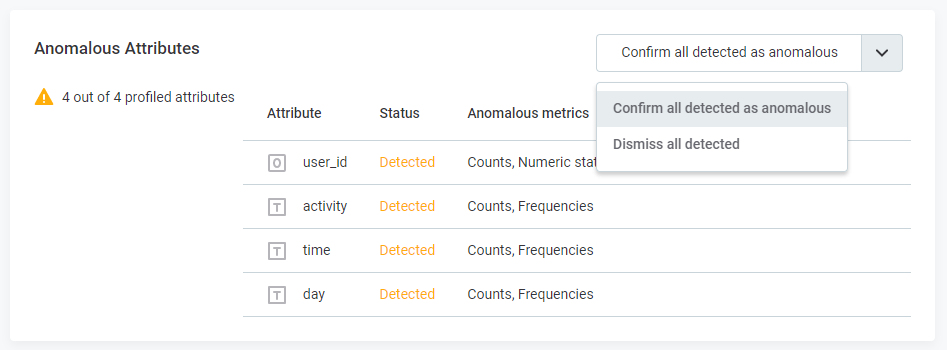
Fine-tune Anomalies in Bulk: For efficiency, use the Anomalous Attributes widget to confirm or dismiss multiple anomalies at once.
Setting Up Anomaly Detection That Works for You
The magic starts from the 6th profile onward. Fewer profiles? Not a problem – the system adjusts to your data's rhythms. For complex patterns, more profiles might be needed. Just keep in mind that Anomaly Detection is your data ally, there to spot even the sneakiest of irregularities.
Crafting Your Anomaly Detection Strategy
Here's your strategy toolkit:
-
Trendy Trends: For trend detection, time-dependent model is your BFF.
-
Data's Growing?: Opt for the time-dependent model if your data grows with each profile.
-
Patterns and Rhythms: If your data dances to daily, weekly, or other periodic beats, the time-dependent model has your back.
-
Sensitivity Tailoring: Adjust sensitivity based on your anomaly appetite. More sensitivity means more flags, while less sensitivity focuses on significant anomalies.
How often do you use Anomaly Detection? What are your best practices? Share them in the comments below 👇

