


Happy Wednesday everyone!
We are halfway through the week and wrapping up our profiling best practices with this post (but honestly are you ever done with profiling?). So let’s dive in to learn how to read a DQ profile, column analyses, and advanced analyses.
Data quality profiles are crucial tools for understanding and improving the quality of your data. Once you've generated a profile, it's important to know how to read and interpret the information it provides.
1. Accessing the Profile Viewer
After running a profiling plan or creating a one-time profile, a file with a .profile extension will appear in your File Explorer. Double-clicking this file opens the Profile Viewer.
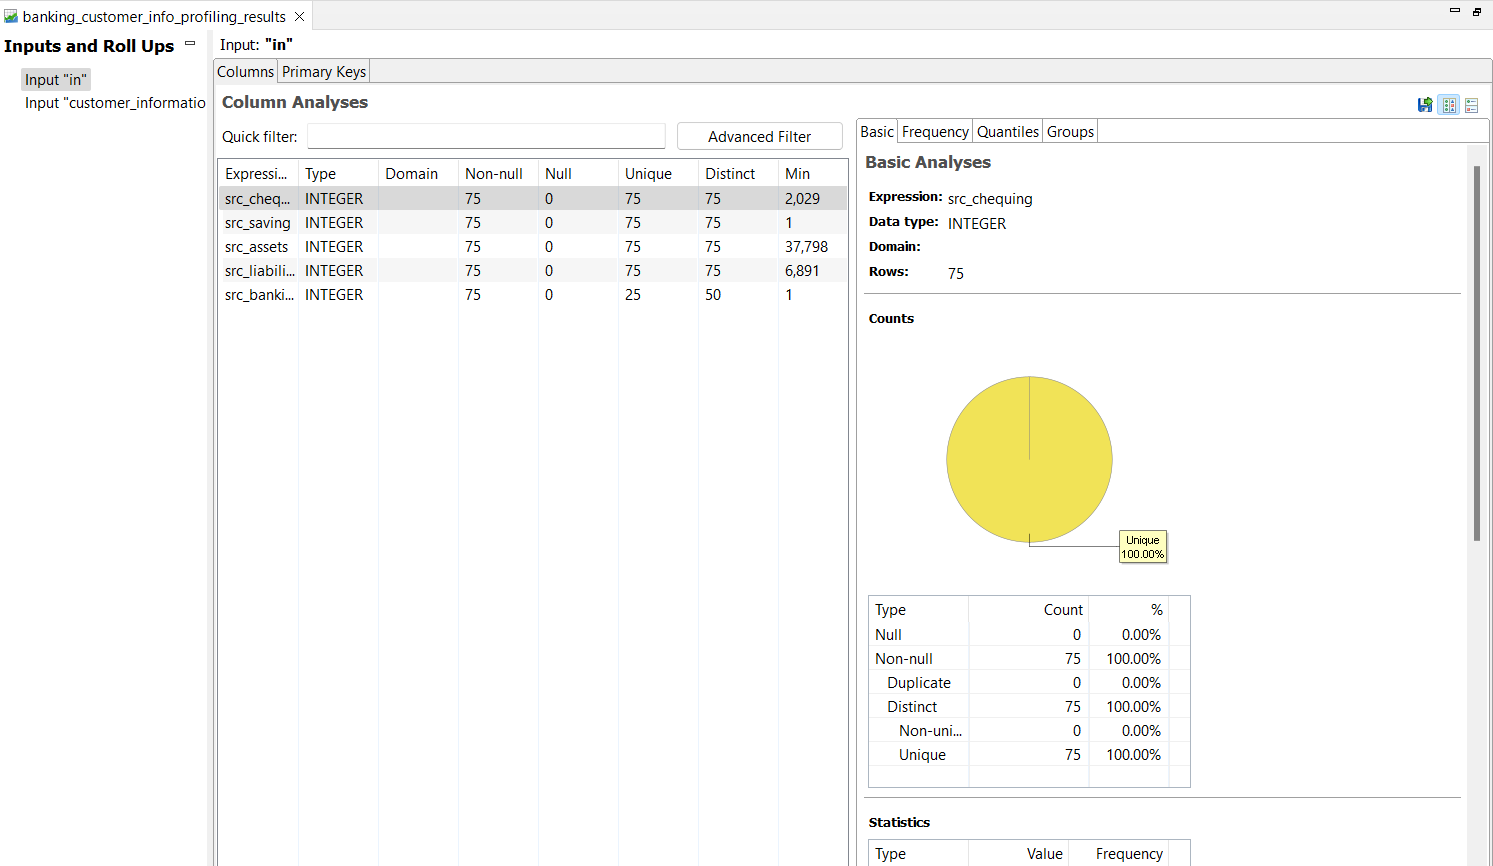
2. Inputs and Roll Ups
The Profiling Step may have multiple inputs, each of which may have associated "roll ups" that group the data by specific parameters. Understanding these inputs and roll ups is vital to gaining a comprehensive view of your data. For detailed information on adding inputs and configuring roll ups, refer to the Input Category and Roll Ups Tab.
3. Understanding Profile Statistics
Data quality profiles contain two main categories of statistics:
Column Analyses
-
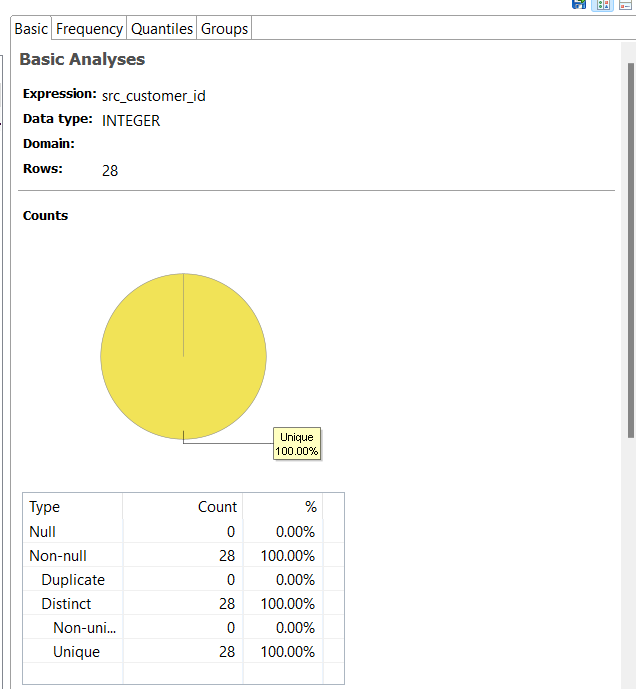
Basic Analyses: Provides simple statistics, such as data type, value counts, and more. This section also includes a chart showing duplicate and distinct data percentages.
-
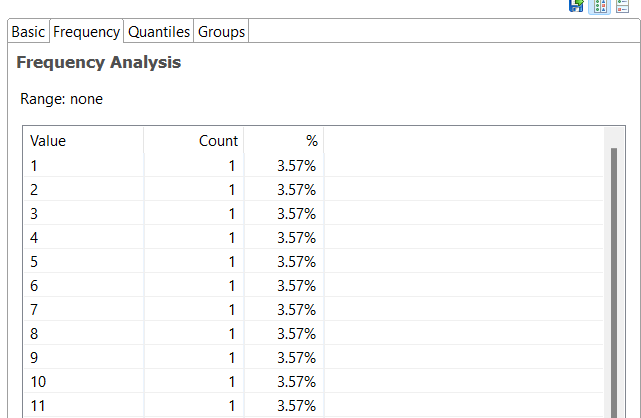
Frequency Analysis: Displays the number of times each value occurs in the data, both as an absolute count and as a percentage of the whole.
-
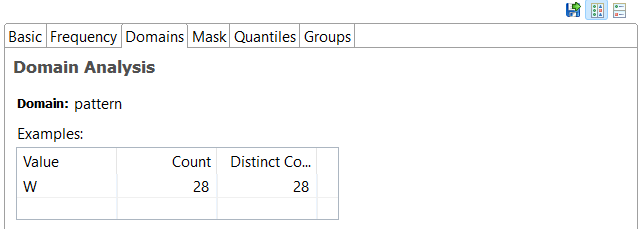
Domain Analysis: Identifies the likely type of data in each column, listing probable types and exceptions.
-
Business Domain Analysis: Determines the kind of data in a business context and shows matched domains and their probabilities.
-
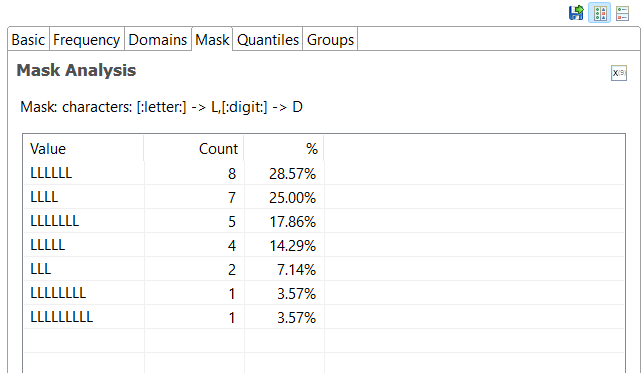
Mask Analysis: Reveals the syntactic patterns or structure of the data using codes or masks.
-
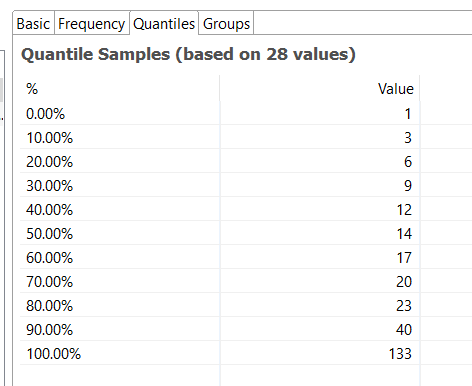
Quantiles: Displays values at designated intervals in the ordered data set, such as the median at the 50% marker.
-
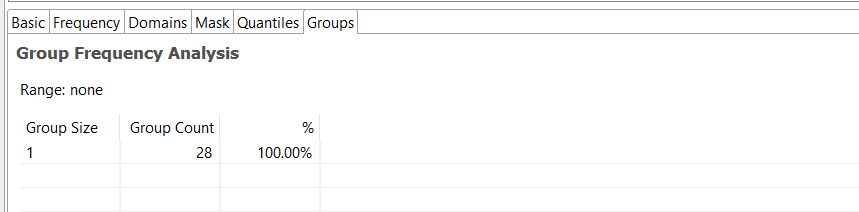
Group Frequency Analysis: Shows the frequency of non-null values and the count of repeated values in the selected column.
Advanced Analyses
-
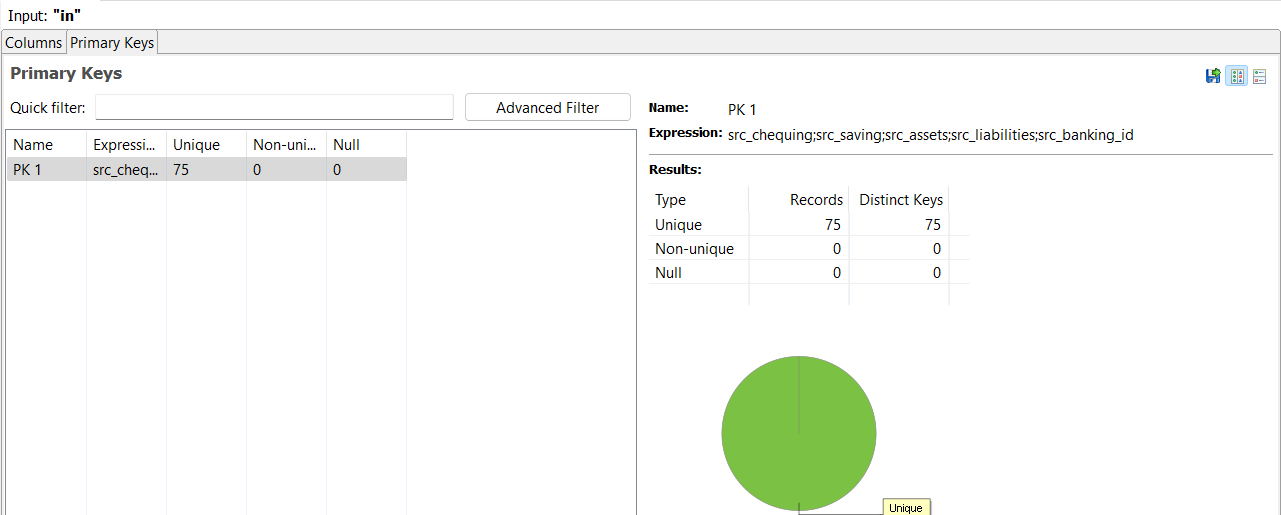
Primary Keys: Assesses whether specified columns could be used as primary keys.
-
Foreign Keys: Evaluates whether one key from an input can be considered a foreign key in relation to another entity.
-
Business Rules: Displays the results of Boolean expressions applied to the input data.
-
Dependency Analysis: Determines whether values of Dependants depend on the value of a Determinant.
Understanding each of these analyses can provide valuable insights into your data's quality and structure.
4. Interpreting Counts
In the "Counts" table, you'll find various values:
- Null: Records that are empty or have "Null" as their value.
- Non-null: Records that are not empty or null (Duplicate + Distinct).
- Duplicate: The number of values that are the same as other values in the list.
- Distinct: The number of non-null values that are different from each other (Non-unique + Unique).
- Non-unique: The number of values that have at least one duplicate in the list.
- Unique: The number of values that have no duplicates.
Understanding these counts is essential to grasp the data's uniqueness and quality.
5. Visualizing Results
Data quality profiles offer visualizations such as charts, graphs, and tables to help you quickly grasp the key statistics. Utilize these visual aids to identify trends and anomalies.
6. Configuring Analysis
Remember that many of the analyses can be configured in the Profiling Step properties. Tailoring these configurations to your specific data and requirements can yield more relevant and accurate results.
Any thoughts, questions, tips? Share them in the comments 👇🏽