

Hi everyone!
We hope that you’ve found our Getting Started with Data Governance best practice series useful! This week we are continuing the Getting Started series with Data Observability 🔭
In this post, we will introduce you to the key components of Data Observability and guide you through the process of configuring it for your data source.
Understanding Data Observability
Data Observability expands on the existing data quality monitoring capabilities in Ataccama. It allows you to gain insights into the state of your data by monitoring data quality, detecting anomalies, and tracking schema changes.
The key components of data observability are:
- Data quality monitoring: Regularly checks data against predefined data quality rules, providing results and trends based on business terms or domains.
- AI-powered anomaly detection: Utilizes AI to identify unpredictable data quality issues, such as sudden drops in data volumes or average values in specific columns.
- Data discovery: Monitors and tracks data issues, helping you understand what data appears in critical systems. It includes continuous data discovery within an automated data catalog and tracks schema changes like newly added or deleted tables and changes in attribute types.
With the components in place you can better understand the nature of your data, including:
- Data quality information. As measured by data validity.
- Schema changes. Data architecture changes in source systems can break reports and affect consuming systems, so checking for removed data attributes or changed attribute types is important.
- Anomalies in various data metrics:
- Changes in data volume
- Statistical metrics such as minimum, maximum, average, or value frequencies
- Changes in business domains of data, such as customer data, product data, transactional data, reference data, etc., or specific business data types, such as
first name,last name,email address,product code,transaction id,gender, andISO currency code. - Any other metadata coming from ETL processes.
Now, let's move on to configuring Data Observability for your source.
Configuring Data Observability for a Source
To configure Data Observability and continuously monitor the health of your data source, follow these steps:
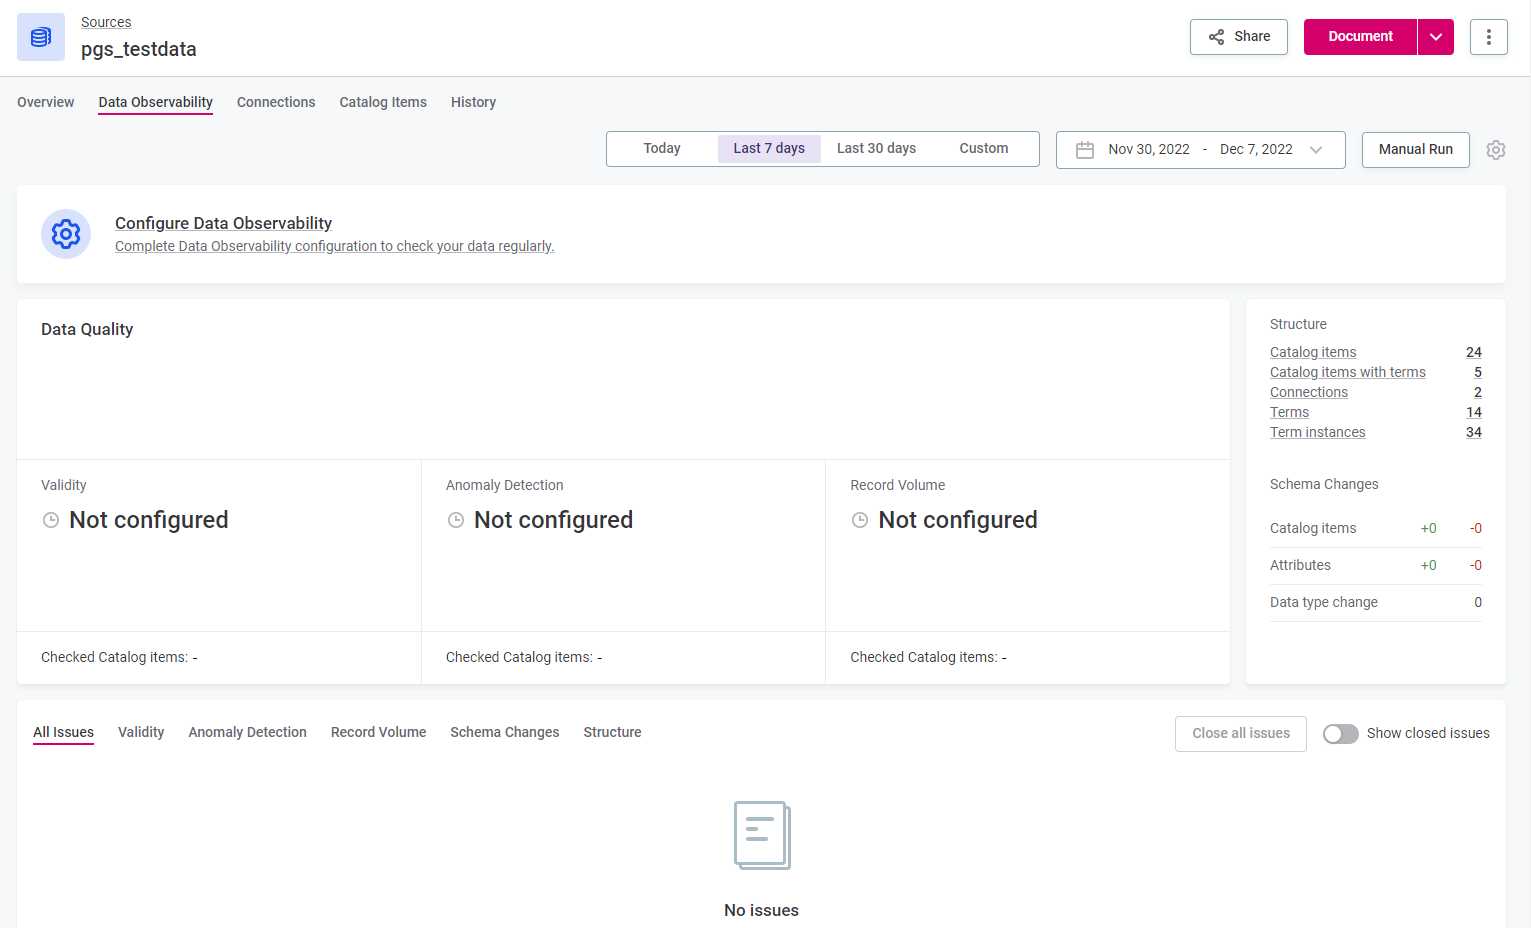
- Open the source you want to configure in the Knowledge Catalog.
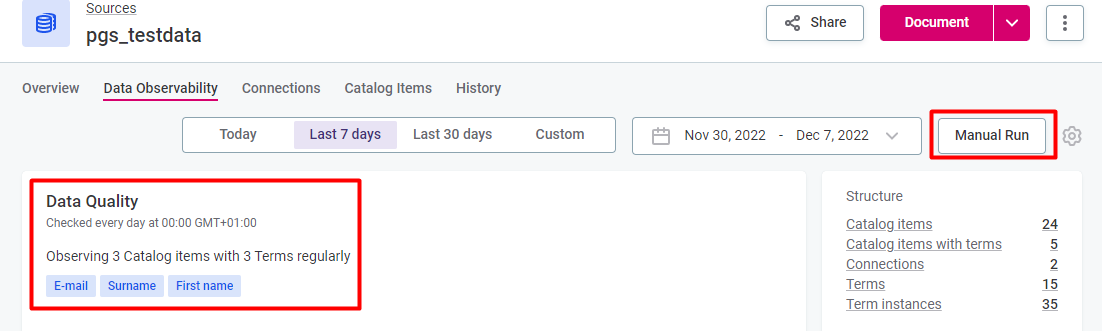
- Go to the "Data Observability" tab and check if there is any existing configuration. If not, select the "Configure Data Observability" banner to start the configuration.
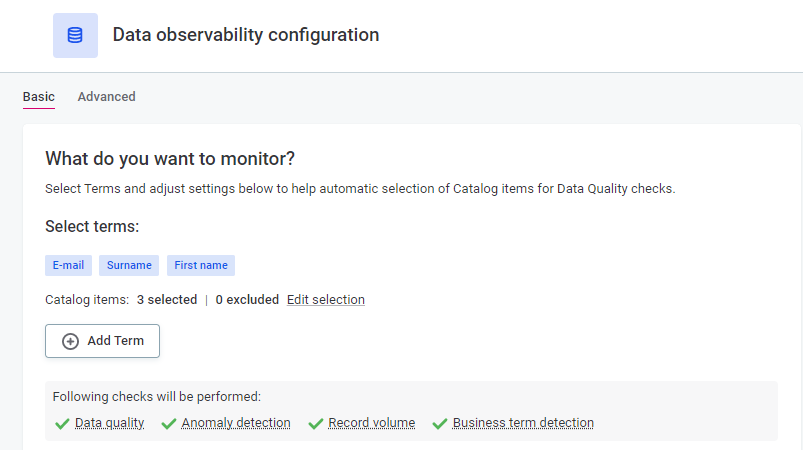
- Choose the business terms or domains you want to monitor. Select the terms that are relevant to your data source, such as "E-mail," "Surname," and "First name." You can exclude specific catalog items if needed.
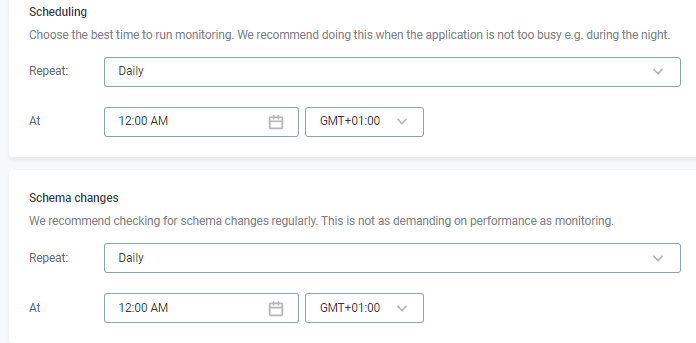
- Define the schedules for general monitoring and detecting schema changes in the data source. The default is set to "Daily," but you can choose a time pattern that suits your requirements.
- Specify the type of notifications you want to receive. Select "In-app" notifications to be alerted within the Ataccama tool. You can also select more than one option, although the additional configuration is needed to integrate with Slack and Microsoft Teams.
- Advanced users can explore additional configuration options on the "Advanced" tab, which allows for more detailed monitoring settings.
6. Once you've completed the configuration, save your changes. A scheduler will be created to observe the data from the source based on the specified schedule.
7. If you want to check the monitoring results immediately, you can manually run the configuration using the "Manual Run" option.
Review and interpret the results obtained based on the current state of your data source. If any issues are reported, you can choose to close them if they're not relevant or create tasks to assign them to responsible colleagues for resolution.
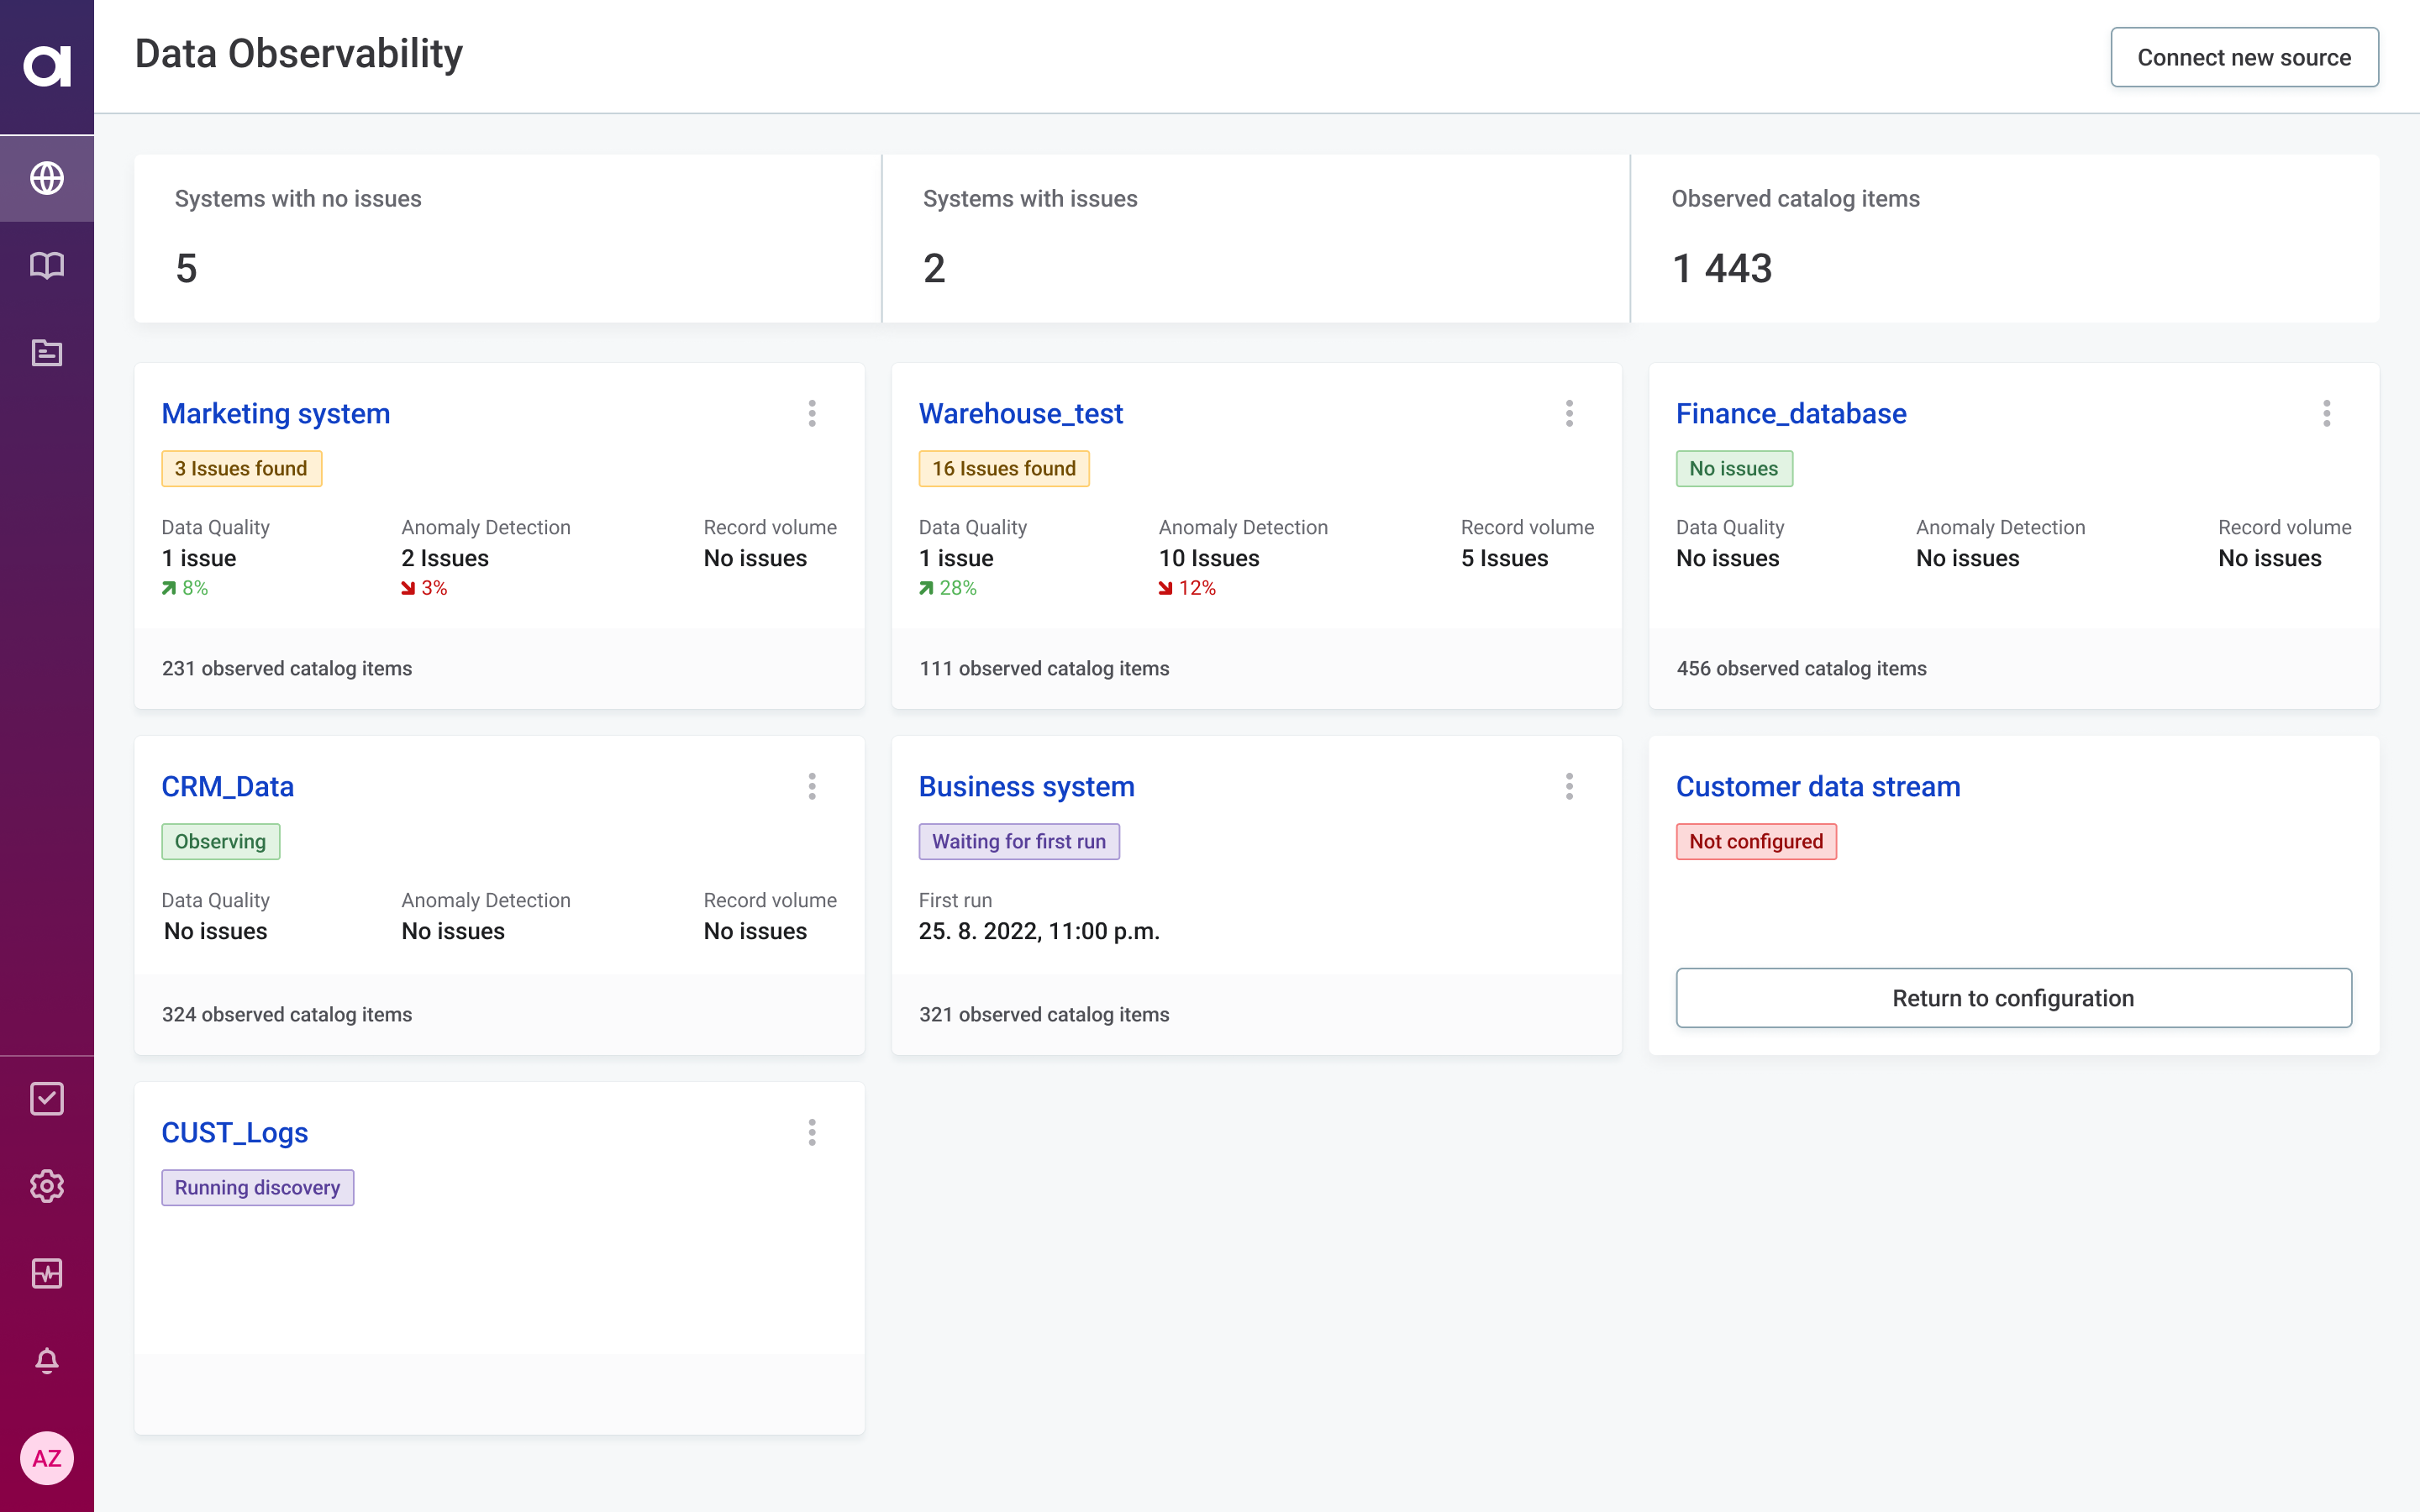
You can access the status of all your sources from the "Data Observability" tab, where you can monitor the health levels of your data and take appropriate actions.
By following these steps, you'll be well on your way to effectively utilizing Data Observability in Ataccama to gain insights into the quality and health of your data.
We hope this guide helps you get started with Data Observability. If you have any questions or best practices on Data Observability please share them in the comments below 👇

