Hi everyone!
Welcome to the third (and the last) part of our introduction series! The continuing posts will be focused on diving deep into the functionalities of DQ. If you have missed the first two posts you can check them out here:
In this post, we'll explore the best practices for monitoring data quality in Ataccama ONE. Monitoring your data quality allows you to track important metrics in real-time and identify potential issues.
Creating a Monitoring Project
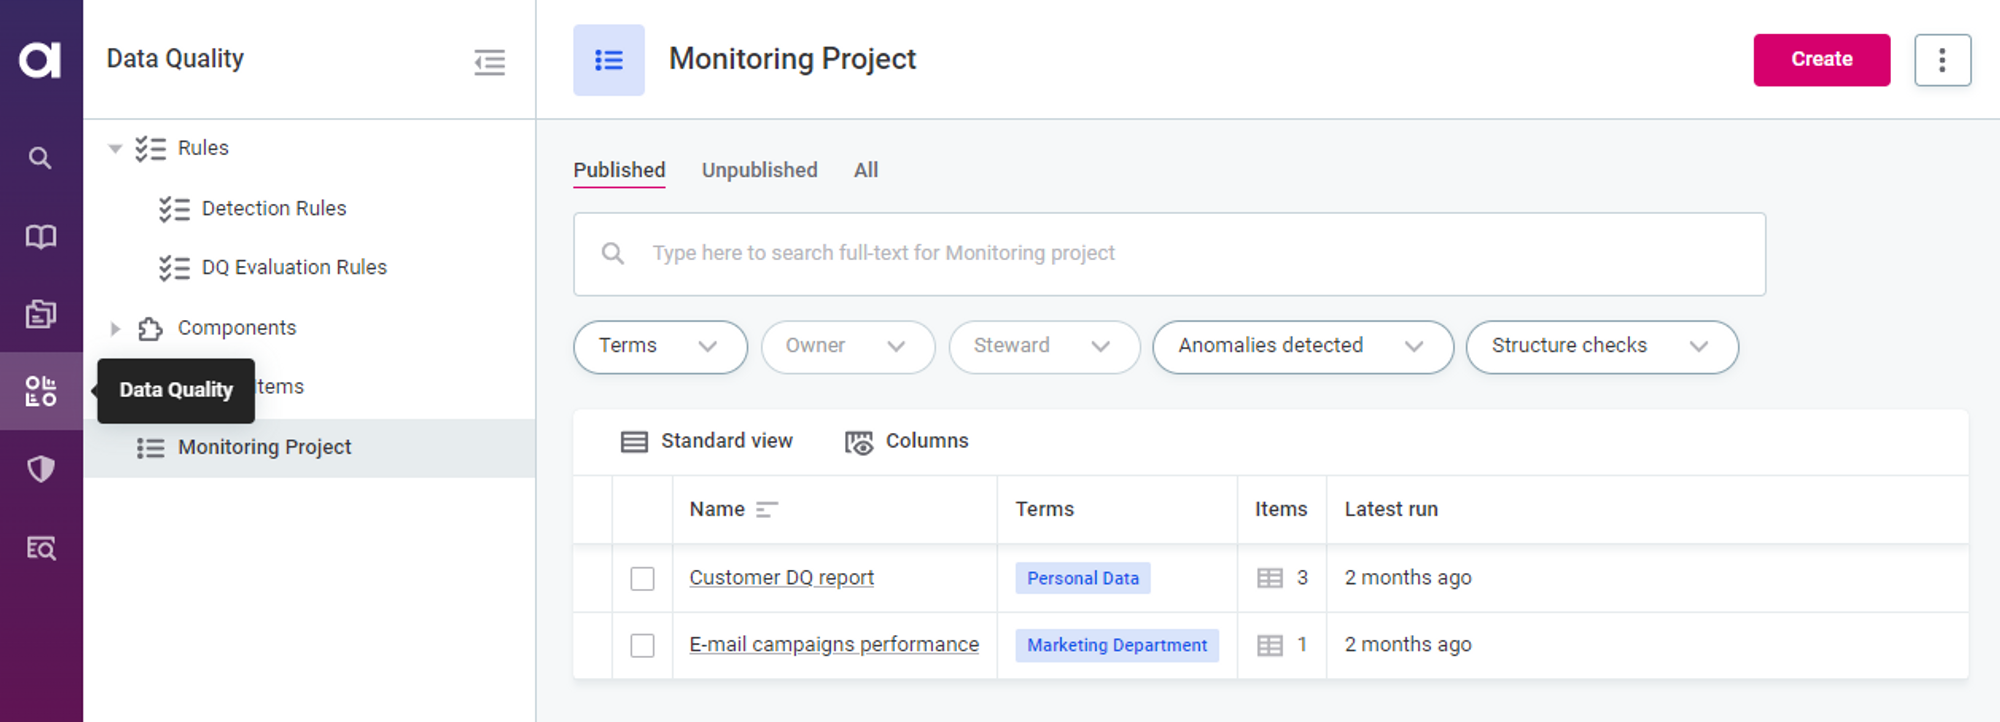
To create a new monitoring project, navigate to "Data Quality" and select "Monitoring Project." Click on "Create" and provide a name and description for your project. On the "Configuration & Results" tab, choose the catalog items you want to monitor. You can monitor multiple catalog items within a single project as long as it makes sense for your organization's data quality requirements.
Customizing DQ Dimensions
In each monitoring project, you can customize the DQ dimensions that contribute to the overall data quality. Look for the "Overall Quality contribution" section on the project's "Overview" tab. Here, you can select the specific DQ dimensions that are relevant to your monitoring project.
Applying DQ Checks
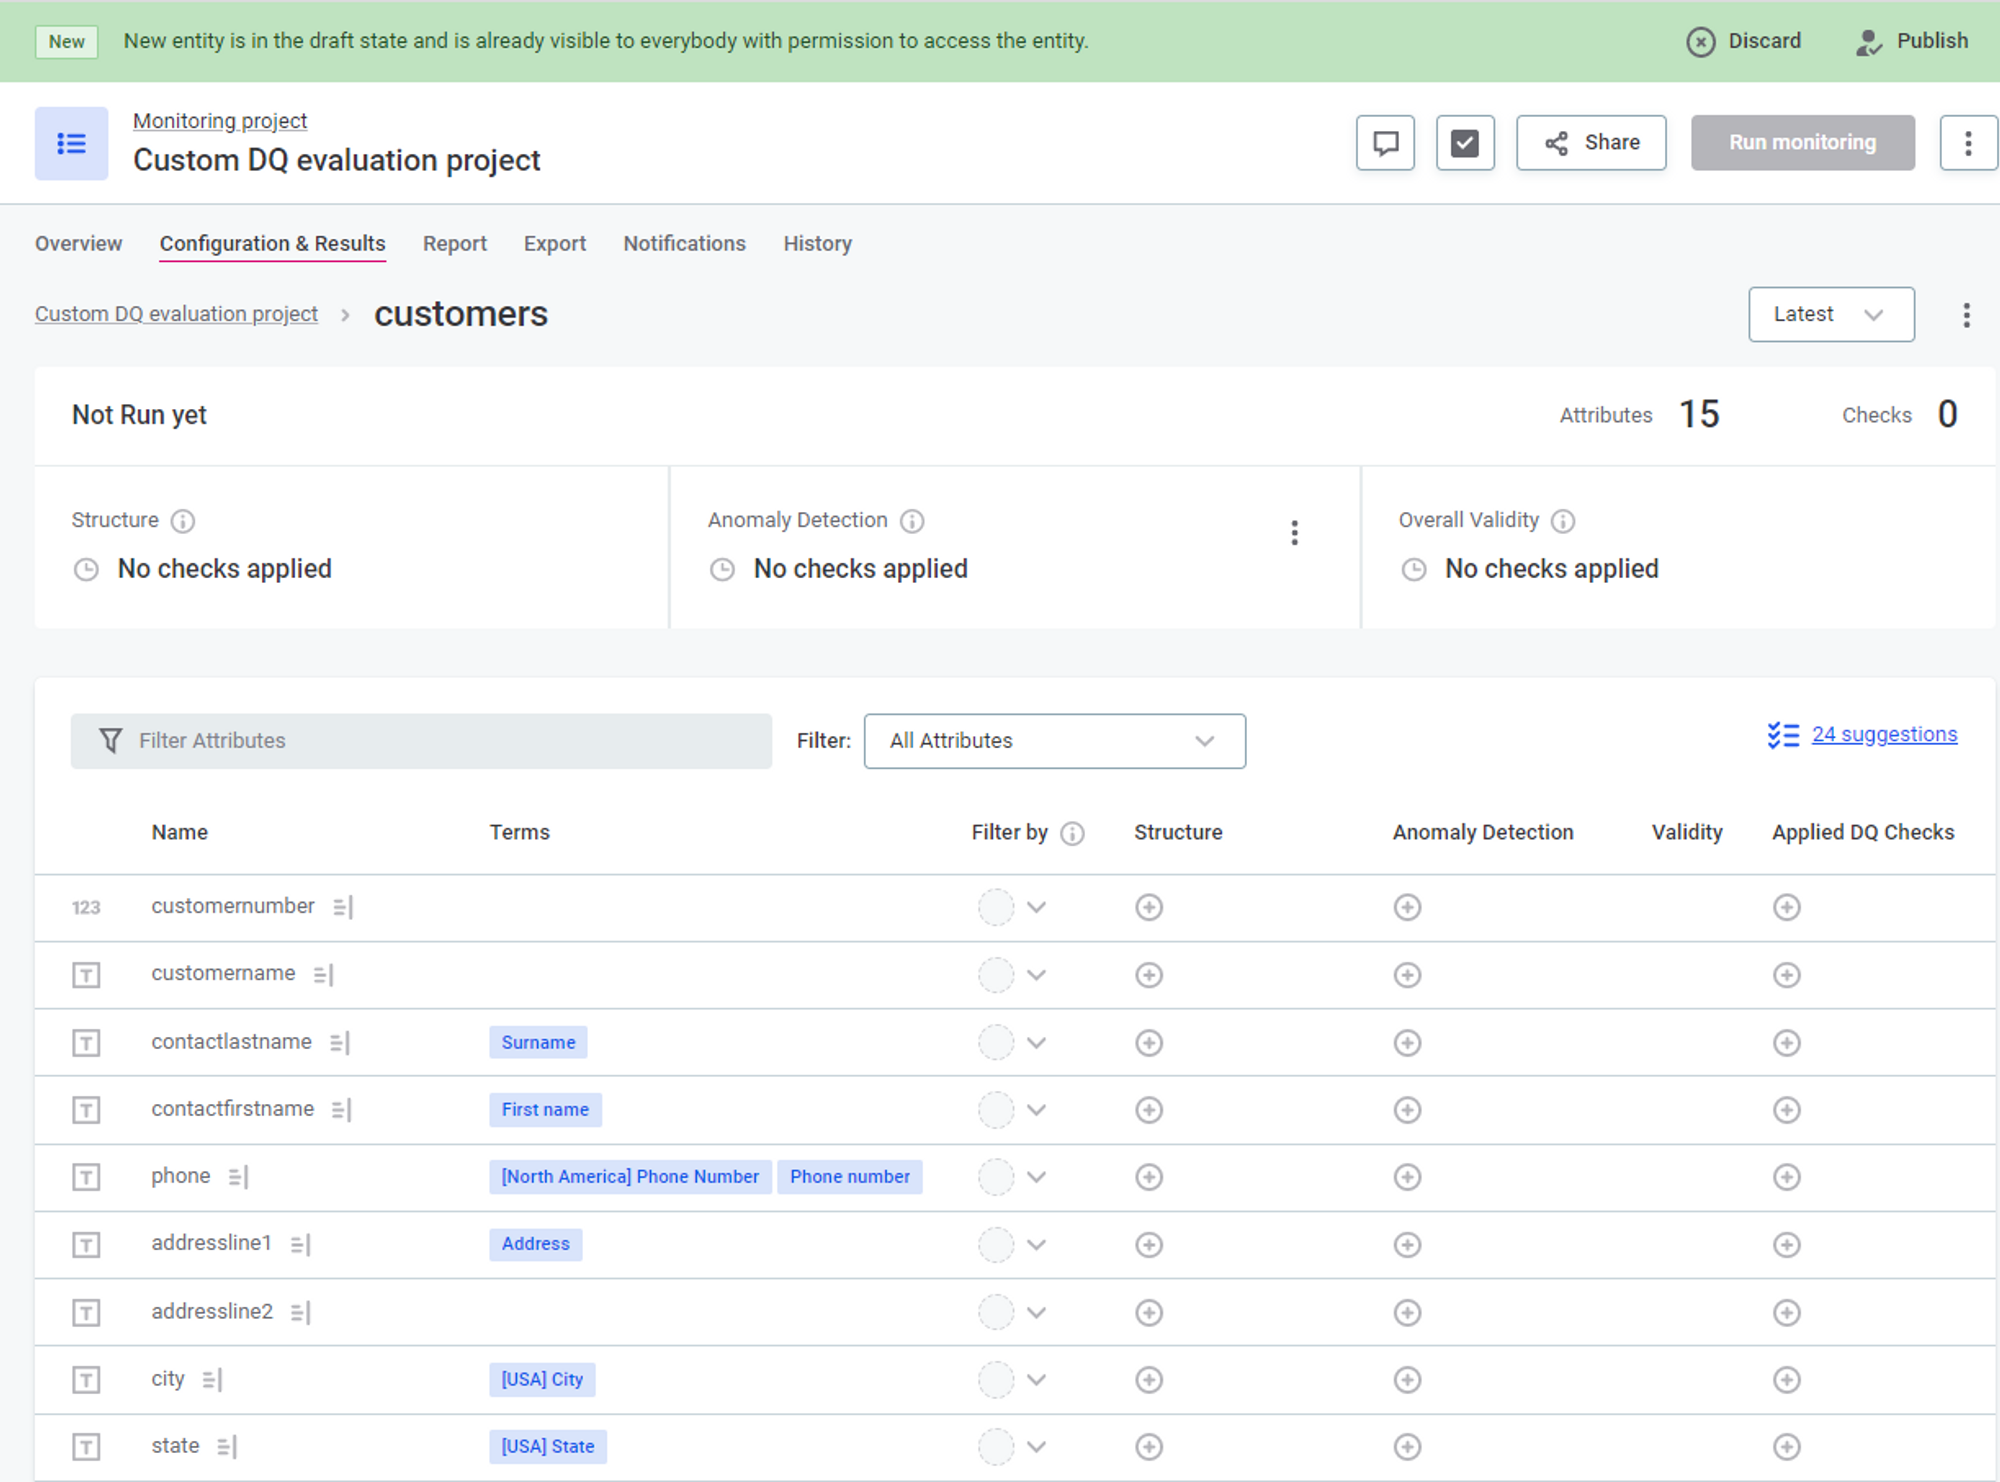
DQ checks are the rules applied to your catalog items in monitoring projects. By default, suggested rules based on assigned business terms will appear in the "DQ Checks" column. Review these suggestions and apply them in bulk by selecting "Accept all suggestions for [catalog item]." You can also manually assign other DQ checks by using the "Applied DQ checks" column. To add a new DQ check, click on "Add DQ Checks" and select the appropriate rules.
Rule Reusability
Take advantage of rule reusability to optimize your DQ checks. You can apply the same rules to different sets of attributes that require the same validation logic. For example, the "String Completeness" rule can be applied to any attribute of type string. However, keep in mind that you'll need a separate completeness rule for each data type (e.g., long, date). Experiment with applying a rule to multiple attributes and compare the validation results.
Running Data Quality Monitoring
Once your monitoring project is set up, publish your changes or submit the draft for publishing. To share the project with other users, use the "Share" option. Open your project and select "Run monitoring" to validate your data. Review the overall quality, individual scores for DQ dimensions, and any reported issues.

Issue Alerts
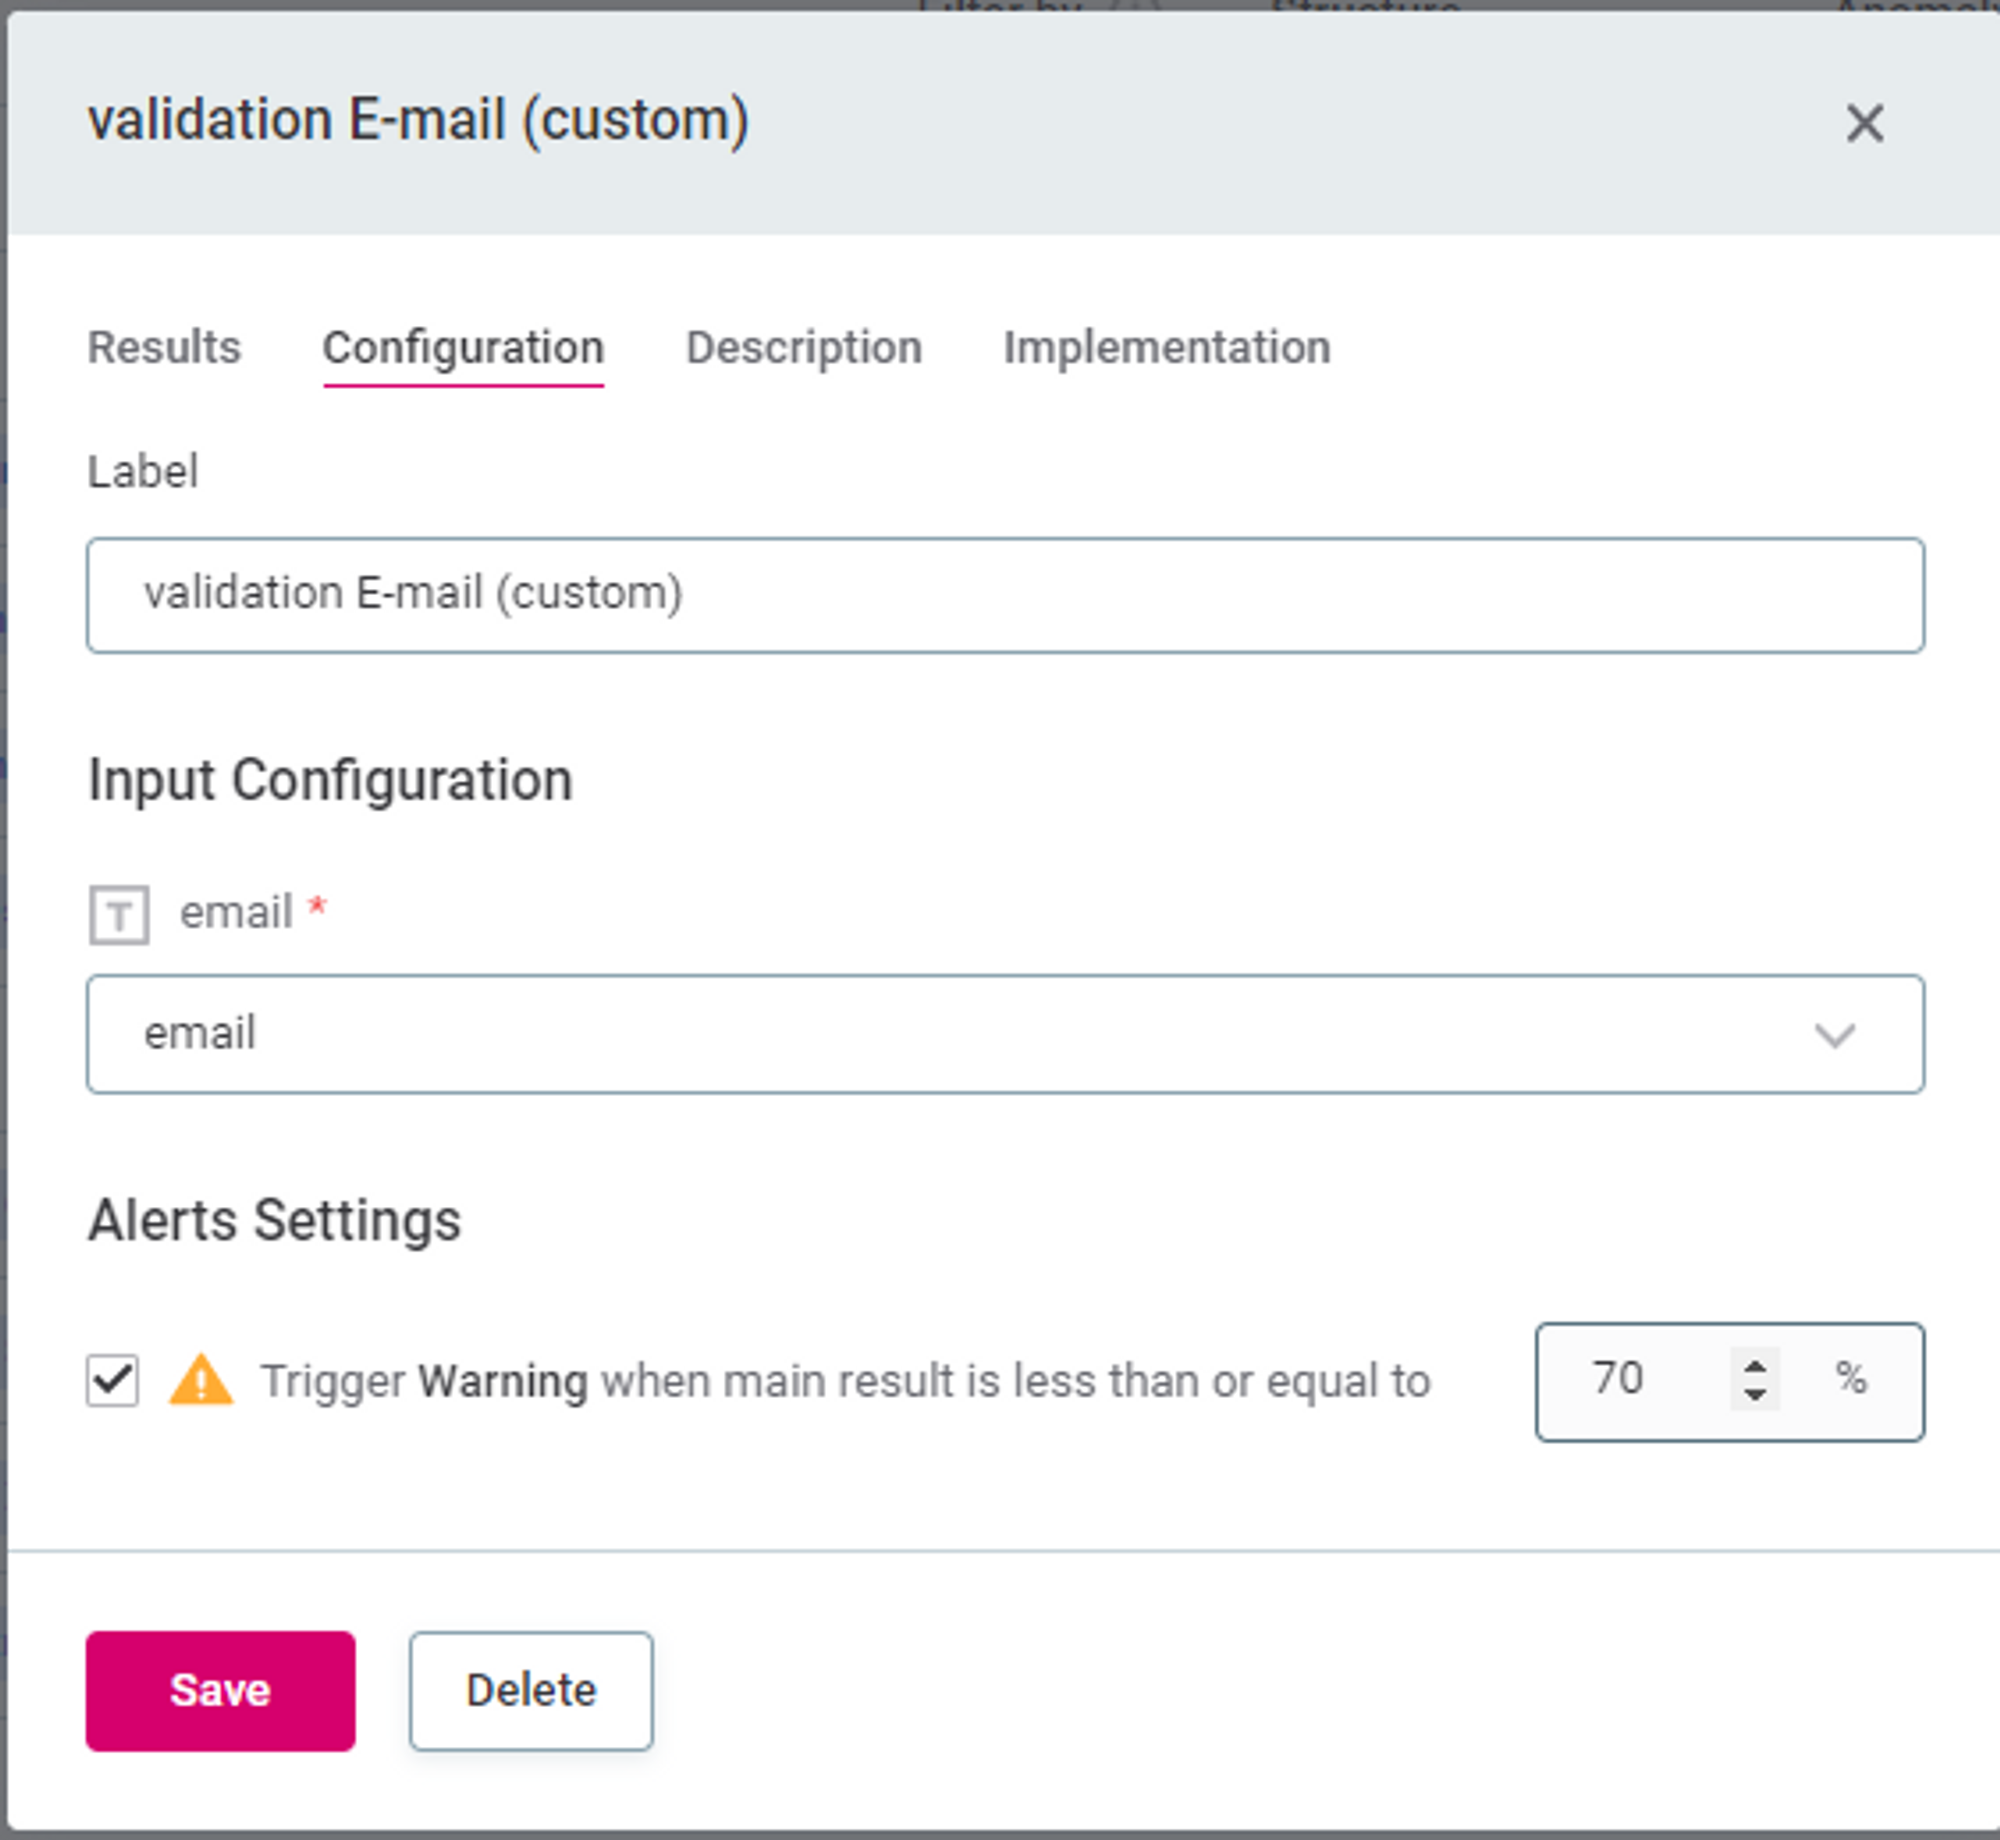
Understanding data quality issues and alert thresholds is crucial. The alert threshold determines when an issue is reported based on the rule configuration. To view and adjust the alert configuration, navigate to the "Configuration & Results" tab, open the catalog item, and select the desired DQ check. In the "Alerts Settings," you can modify the alert threshold to control when issues are reported.

Investigating Invalid Samples
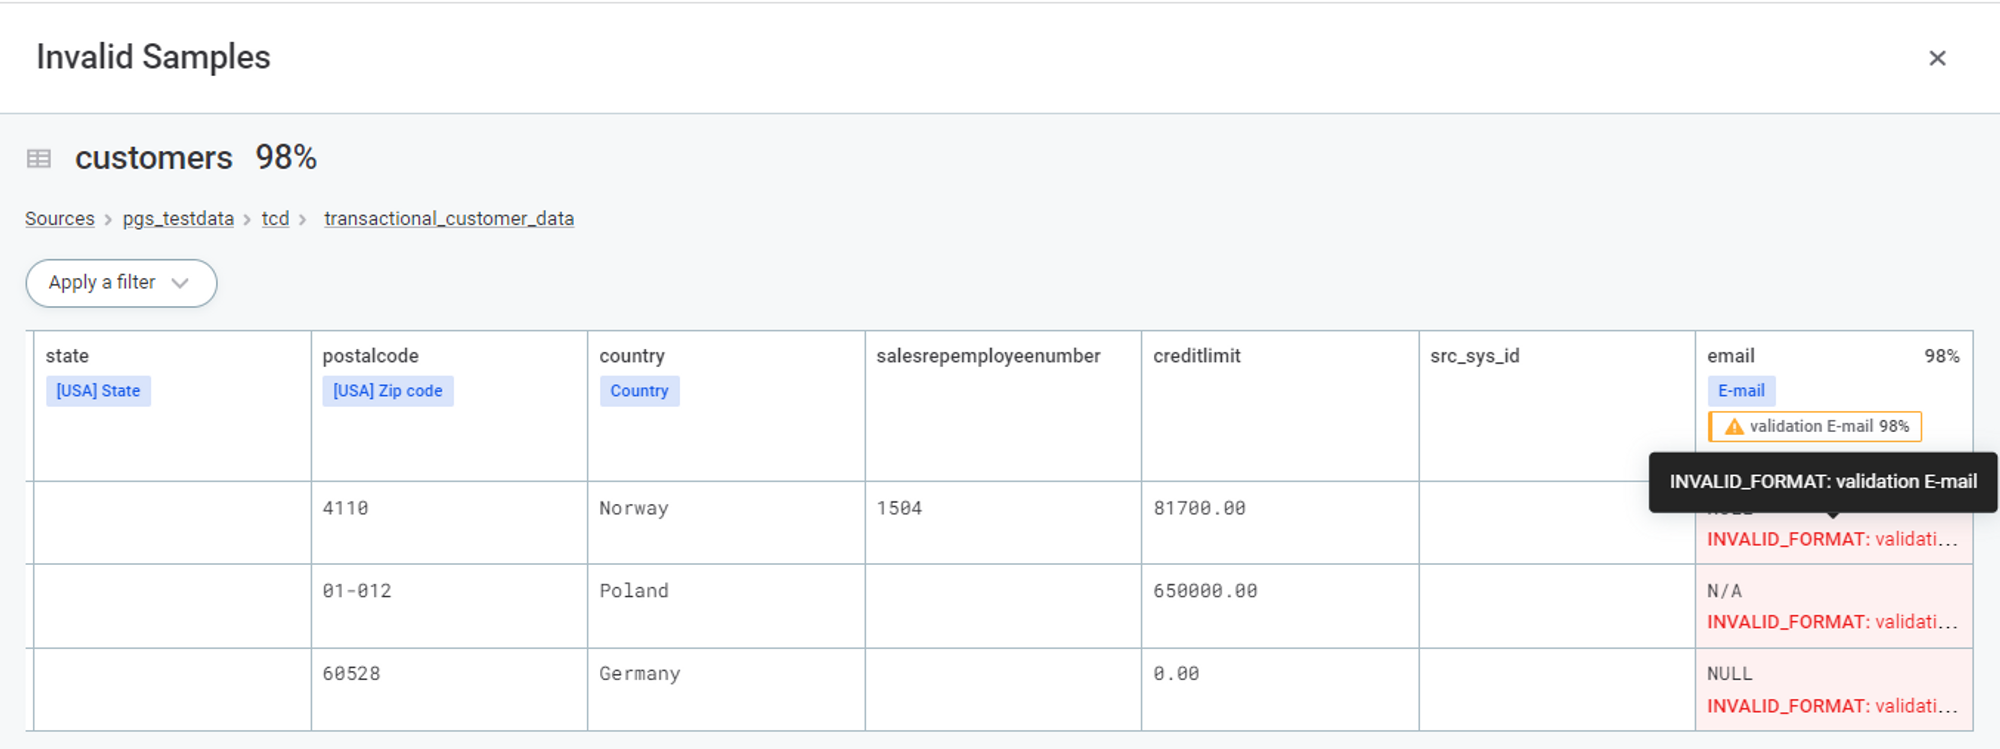
When issues are detected, analyzing a sample of records that failed the assigned DQ checks provides insights into the problem. On the "Configuration & Results" tab, select "Show invalid samples." Compare the values in flagged records with the applied rules. Switch between monitored catalog items to identify the scope of the issue. You can configure the number of invalid results included in the sample or disable this option altogether through the "Configuration of Invalid Results Samples" menu.
Reports
To gain an aggregated view of DQ results and anomalies over time, navigate to the "Report" tab. Here, you can observe changes in data quality for the entire project or focus on specific catalog items, DQ dimensions, or assigned checks. The report allows you to delve into the details of identified issues for further analysis.
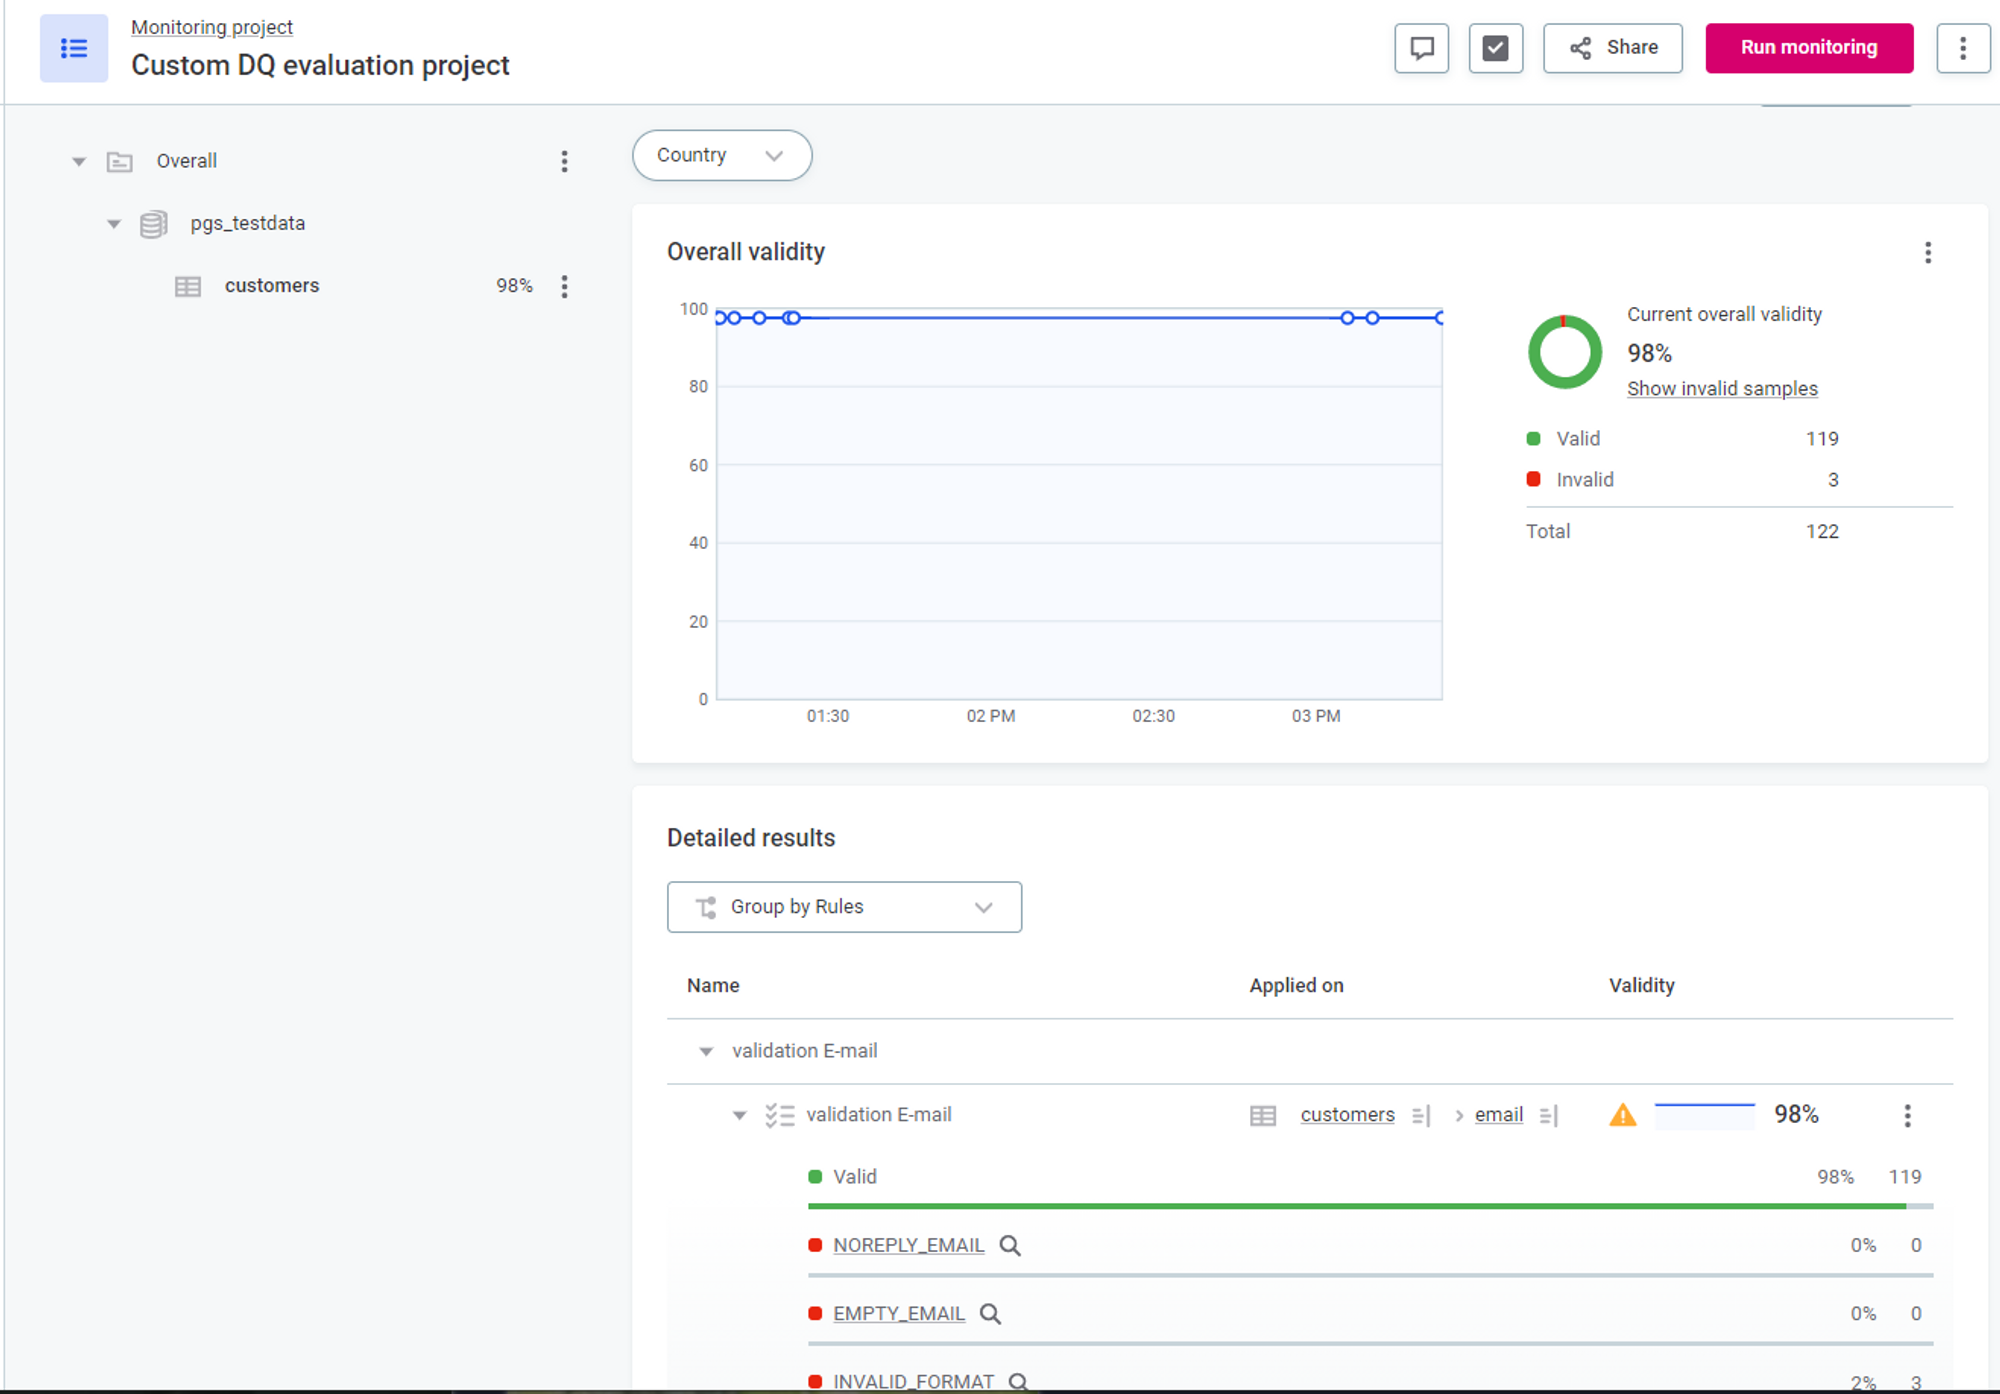
By following these best practices, you can effectively monitor data quality in Ataccama ONE, enabling proactive identification and resolution of potential issues in your data.
Stay tuned for the deep-dive "Getting Started with DQ" series!
