Question

Reproducing the Term level Data Quality overview from GraphQL


Hi Ataccama community,

I’m hoping someone with better grip on the Ataccama GraphQL model can shine a light on this. 

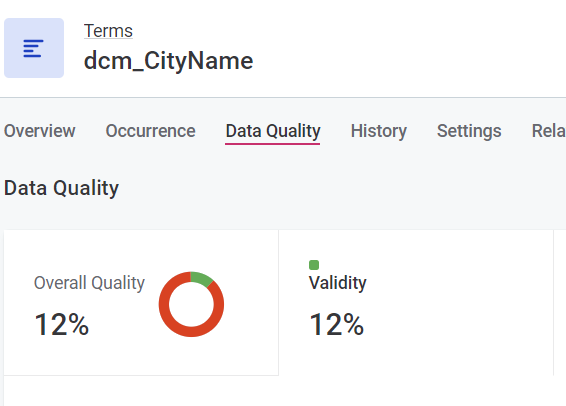
For internal reporting, we are looking to retrieve data quality details via the Ataccama GraphQL API. One of the requests it to produce an overview of the DQ score across the (rule’s) DQ dimensions. This is basically the same as is shown in the web UI when navigating to the ‘Data Quality’ tab for a Term. It shows the score broken down by dimensions, based on how the rules are defined.

What I’m trying to do is retrieve the passed/failed rows at this level, so for each term and each dimension. This would allow me to summarise this into a score per dimension.

However,  I am unable to get this out of the API.

I’ve approached this from both the ‘terms’ and ‘rules’ pathway. In both approaches I always end up with the ‘Overall Quality’ score for each term - not the per dimension details.

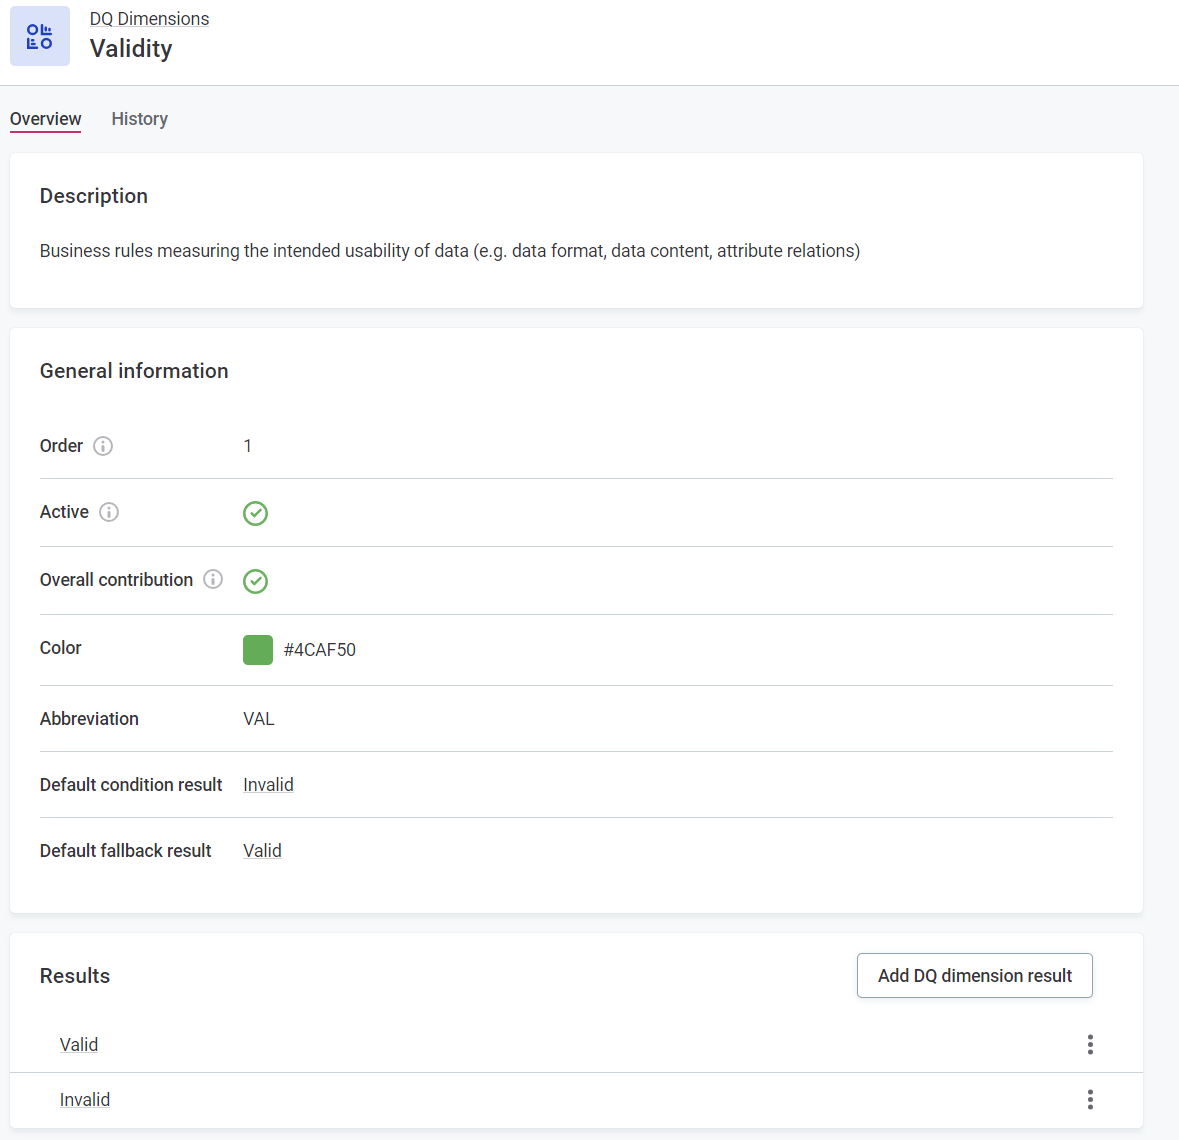
The ‘rules’ query looks promising, but ultimately only returns the passed/failed records for the overall quality score, not specifically the rule that applies (for example the accuracy rule).

For reference, this is the attempt starting from the (list of) rules:

1query listRules {
2rules (versionSelector: {draftVersion: true} filter: "implementation.$type =='ruleDqImplementation'") {
3 edges {
4 node {
5 gid
6 publishedVersion {
7 name
8 ruleDefinitionSource
9 #description
10 implementation {
11 gid
12 #type
13 publishedVersion {
14 aggregationRule
15 component
16 dqDimension {
17 publishedVersion {
18 name
19 }
20 }
21 }
22 }
23 termInstances {
24 edges {
25 node {
26 gid
27 publishedVersion {
28 displayName
29 target
30 {
31 gid
32 publishedVersion {
33 name
34 dqEvalTermAggr {
35 storedVersion {
36 ruleCount
37 recordCount
38 invalidCount
39 validCount
40 }
41 }
42 }
43 }
44 }
45 }
46 }
47 }
48 }
49 }
50 }
51 }
52}

And this is the attempt starting from the list of term, trying to find out what rules apply and ideally retrieving the scores from there:

1query listGlossaryTerms {
2 terms(versionSelector: { draftVersion: false }) {
3 edges { # List of terms
4 node{
5 gid
6 publishedVersion { # Individual term
7 name
8 dqEvalTermAggr {
9 storedVersion {
10 ruleCount
11 recordCount
12 invalidCount
13 validCount
14 }
15 }
16 validationRules {
17 publishedVersion {
18 enabled
19 ruleInstances { #listwrapper (list of rules)
20 edges {
21 node { #nodewrapper
22 gid
23 nodePath
24 storedVersion { # individual rule
25 displayName
26 }
27 }
28 }
29 }
30 }
31 }
32 stewardship {
33 gid
34 nodePath
35 type
36 draftVersion {
37 name
38 }
39 }
40 }
41 }
42 }
43 }
44}

Does anyone know which route to take to find the scores per dimension? By looking at the page setup there seems to be a dqEvalTermOverview object that contains this, but I don’t know how to access this via GraphQL.

Did this topic help you find an answer to your question?

4 replies

  • Author
  • Data Voyager
  • 3 replies
  • October 16, 2024

An update, because there is so little to find about this. Not 100% what I’m looking for, but with the help of Ataccama support I ended up with this one:

1query listGlossaryTerms {
2 terms(versionSelector: { draftVersion: false }) {
3 edges { # List of terms
4 node{
5 gid
6 publishedVersion { # Individual term
7 name
8 dqEvalTermAggr {
9 storedVersion {
10 ruleCount
11 recordCount
12 invalidCount
13 validCount
14 }
15 }
16 validationRules {
17 publishedVersion {
18 enabled
19 ruleInstances { #listwrapper (list of rules)
20 edges {
21 node { #nodewrapper
22 gid
23 nodePath
24 storedVersion { # individual rule
25 displayName
26 }
27 }
28 }
29 }
30 }
31 }
32 stewardship {
33 gid
34 nodePath
35 type
36 draftVersion {
37 name
38 }
39 }
40 dimensionAggregationResults {
41 dimensionId
42 attributeCount
43 catalogItemCount
44 totalCount
45 ruleInstanceCount
46 results {
47 id
48 name
49 count
50 }
51 }
52 }
53 }
54 }
55 }
56}

This way, the dimension id can be cast as the name - but I haven’t found a way to get the name returned straight away.


Forum|alt.badge.img+1

Hi @RoelantVos, welcome to the community and thank you for posting & sharing the solution. I’ve just pinned the post to see if there are any community members who can offer some ideas here 🧠


OGordon100
Ataccamer
Forum|alt.badge.img
  • Ataccamer
  • 21 replies
  • November 20, 2024

Hello!

Thanks for your patience on this one.

Just so I understand correctly, the end goal here is to provide a % pass/fail metric for a full dimension? So just like the below image where we aggregate for a single term, but aggregating against all evaluated rules? (And the above queries being a way of getting this via terms?) 


If so, I’ve spent a few hours looking into this for you, and introspecting the graphQL schema behind the scenes.


First thing’s first - unfortunately we do not hold anywhere in the platform/GraphQL schema aggregations for each dimension against all rules/terms. This is why if you look at the respective dimension page, there is no widget showing aggregations


Secondly, going via terms in the above queries will likely result in an inaccurate calculation. This is as there are two pathways to mapping rules; via terms, and direct to the catalog. It is therefore likely that information will be missed out of the calculations.


So what is the best way to proceed? While we do not directly store this data in the product, it is technically possible for you to derive it yourself. You would go down the route of getting dimension aggregations against each catalog item, and then weighting by the number of rows in the catalog item (which you would get from profiling results). How you do this will depend on how you map rules in Ataccama.

  1. If you map rules in Monitoring Projects, you would extract the aggregations for each Catalog Item from the “Report” section in a Monitoring Project. Your path through the metadata model in the query would basically be Catalog Item → Aggregation Stats + Profiling
  2. If you map rules directly to a catalog item, you would extract the aggregations from the “Data Quality” section of a Catalog Item. (You may also need some additional filtering to account for duplicate CIs across multiple MPs). Your path through the metadata model in the query would basically be Monitoring Project → Catalog Items Aggregation Stats + Catalog Item → Profiling 

You can get the profiling results with 

1query getAllProfiling {
2 catalogItems(versionSelector: { publishedVersion: true } size: 10 skip: 0) {
3 edges {
4 node {
5 publishedVersion {
6 name
7 profilingConfigurationInstances {
8 edges {
9 node {
10 publishedVersion {
11 profiles(
12 size: 1
13 orderBy: { property: "profiledAt", direction: DESC }
14 ) {
15 edges {
16 node {
17 publishedVersion {
18 profiledAt
19 attributeProfiles {
20 edges {
21 node {
22 publishedVersion {
23 displayName
24 attribute {
25 publishedVersion {
26 dataType
27 termInstances {
28 edges {
29 node {
30 publishedVersion {
31 displayName
32 }
33 }
34 }
35 }
36 }
37 }
38 anomalyState {
39 publishedVersion {
40 state
41 }
42 }
43 attributeProfileData {
44 publishedVersion {
45 distinctCount
46 duplicateCount
47 frequencyCount
48 frequencyGroupsCount
49 masksCount
50 minValue
51 maxValue
52 nonUniqueCount
53 nullCount
54 numMin
55 numMean
56 numMax
57 numStdDeviation
58 numSum
59 numVariance
60 patternsCount
61 stringMinLength
62 stringMeanLength
63 stringMaxLength
64 totalCount
65 uniqueCount
66 frequencyGroupsHead(
67 orderBy: {
68 property: "count"
69 direction: DESC
70 }
71 size: 3
72 ) {
73 edges {
74 node {
75 publishedVersion {
76 value
77 count
78 }
79 }
80 }
81 }
82 masksHead(
83 orderBy: {
84 property: "count"
85 direction: DESC
86 }
87 size: 3
88 ) {
89 edges {
90 node {
91 publishedVersion {
92 value
93 count
94 }
95 }
96 }
97 }
98 patternsHead(
99 orderBy: {
100 property: "count"
101 direction: DESC
102 }
103 size: 3
104 ) {
105 edges {
106 node {
107 publishedVersion {
108 value
109 count
110 }
111 }
112 }
113 }
114 quantiles(
115 orderBy: {
116 property: "percentile"
117 direction: DESC
118 }
119 size: 3
120 ) {
121 edges {
122 node {
123 publishedVersion {
124 value
125 percentile
126 }
127 }
128 }
129 }
130 }
131 }
132 }
133 }
134 }
135 }
136 }
137 }
138 }
139 }
140 }
141 }
142 }
143 }
144 }
145 }
146 }
147 }
148}


That is for the short term... in the long term, I can pass on the suggestion to provide this aggregation directly in the product. Would you be able to share a bit on your use case and the reasons for wanting to see results aggregated to a dimension level? I will share it with our product team.


Best of luck!

Oli


  • Author
  • Data Voyager
  • 3 replies
  • November 24, 2024

Hi ​@OGordon100,

Thank you for your response, it shows some new tricks in Ataccama that are useful to have. The use case is about being able to report on data quality metrics outside of Ataccama, e.g. using a 3rd party tool such as Power BI. While we think the in-app reporting is good, it’s usually more geared at a technical level and for business owners of the data we want to show the reports at a higher level - such as a list of scores aggregated per term (and in this case, broken down by data quality dimension). 

Data stories only supports catalog items and monitoring projects, and even if it would also support business terms there is still a need to expose some of this data combined with details collected from outside Ataccama.

For the most part, we’re able to retrieve the details from Ataccama we need. We do this by running a procedure in our Snowflake environment that fetches the details via a GraphQL call. This way, we can ‘connect’ Ataccama and reporting directly. However, and to your point, not all data is directly available and in some cases getting all details requires multiple calls and some logic to join these details together.

Similar: 


Kind regards,

Roelant


Cookie policy

We use cookies to enhance and personalize your experience. If you accept you agree to our full cookie policy. Learn more about our cookies.

 
Cookie settings