Solved

Query the monitoring report results at item level

  • November 8, 2024
  • 3 replies
  • 105 views

I’m hoping anyone has some good GraphQL examples to share. For us, it is necessary to integrate Ataccama into our standard reporting. To do so I’m trying to get a GraphQL working that returns the scores for each item in a monitoring project. Ideally, listing out all monitoring projects and items with their scores - for the latest processing (although I’ll take all at this point and filter the old ones later). This is all about the statistics (# records passed/failed etc. not the individual results - I am aware I can create post-processing plans to export data, but this is not applicable here).

It’s basically the overview from the report tab in the monitoring project, at item level:

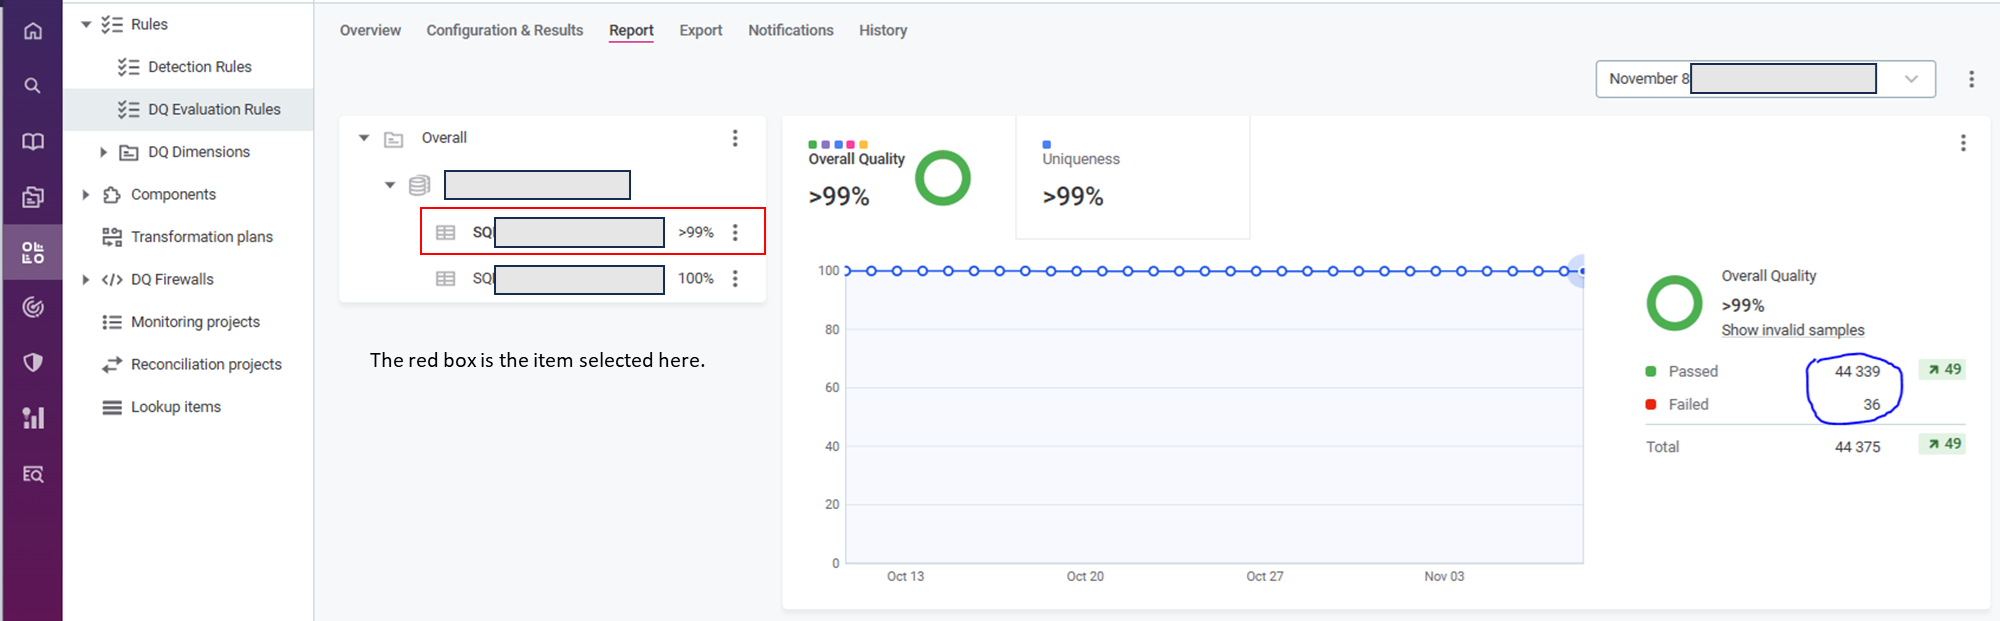
I can get everything I need, including the total row count except the passed or failed figure. I have tried and looked at all GraphQL examples everywhere, including favicon-16x16.pngONE API :: Ataccama ONE, and have pieced this together based on the structures visible in the desktop app. Things like DqAggregationResultOverTime don’t really cut it, because it already aggregates across dq dimensions, and I’m interested in the per-item information.

How can I report on passed/failed for each item in a monitoring project, ideally without explicitly listing the catalog item (because we have hundreds)?

The query below is close, all it’s missing is the passed and/or failed count.

1query listMonitoringProject {
2 monitoringProject(gid: "<gid>") {
3 gid
4 publishedVersion {
5 name
6 processings {
7 edges {
8 node {
9 gid
10 publishedVersion {
11 __typename
12 startedAt
13 state
14 result
15 dqResult {
16 publishedVersion {
17 __typename
18 startedCount
19 statistics {
20 publishedVersion {
21 successCount
22 }
23 }
24 }
25 }
26 items {
27 edges {
28 node {
29 publishedVersion {
30 __typename
31 catalogItem {
32 publishedVersion {
33 name
34 }
35 }
36 result
37 dqResult {
38 __typename
39 gid
40 publishedVersion {
41 result
42 dqResult {
43 storedVersion {
44 __typename
45 ruleCount
46 recordCount
47
48 }
49 }
50 }
51 }
52 }
53 }
54 }
55 }
56 }
57 }
58 }
59 }
60 }
61 }
62}
63


Best answer by RoelantVos

Hi all,

In case others attempt something similar, this is not directly possible and requires multiple data sets to be retrieved and combined.

Ataccama support sent a helpful component for the desktop application, and that works. I’ve also refactored this into GraphQL calls, and it’s possible to piece this overview together by combining the following:

Get the passed/failed indicator for each dimension pathway.

1query listDataQualityDimensions {
2dqDimensionResults(
3 versionSelector: { publishedVersion: true }
4 ) {
5 edges {
6 node {
7 gid
8 publishedVersion {
9 _displayName
10 passedOverallResult
11 }
12 }
13 }
14 }
15}

Get the monitoring projects and catalog items following the configuration details. 

1query listMonitoringProject
2 {
3 monitoringProjects (versionSelector: { draftVersion: false }) {
4 edges {
5 node {
6 gid
7 publishedVersion {
8 __typename
9 name
10 configuration {
11 __typename
12 publishedVersion {
13 items {
14 edges {
15 node {
16 gid
17 publishedVersion {
18 displayName
19 dqChecks {
20 edges {
21 node {
22 __typename
23 gid
24 publishedVersion
25 {
26 __typename
27 displayName
28 mappings {
29 edges {
30 node {
31 __typename
32 gid
33 publishedVersion
34 {
35 catalogItemAttribute
36 {
37 publishedVersion
38 {
39 name
40 }
41 }
42 }
43 }
44 }
45 }
46 }
47 }
48 }
49 }
50 }
51 }
52 }
53 }
54 }
55 }
56 }
57 }
58 }
59 }
60 }

Use these details to collect the results per project / item / check using the dqCheckResultsOverTime query:

1query CheckResults {
2 monitoringProject(gid: "<monitoring_project_gid>") {
3 publishedVersion {
4 dqCheckResultOverTime(
5 selector: { limit: 1 }
6 catalogItemId: "<item_gid>"
7 checkIds: ["<dq_check_gid>"]
8 ) {
9 processingId
10 startedAt
11 results {
12 dqCheckId
13 results {
14 id
15 count
16 name
17 }
18 }
19 }
20 }
21 }
22 }

Combining these three sets can re-create this overview.

The desktop app component uses the same building blocks.

View original
Did this topic help you find an answer to your question?

3 replies

  • Author
  • Data Voyager
  • 3 replies
  • Answer
  • November 24, 2024

Hi all,

In case others attempt something similar, this is not directly possible and requires multiple data sets to be retrieved and combined.

Ataccama support sent a helpful component for the desktop application, and that works. I’ve also refactored this into GraphQL calls, and it’s possible to piece this overview together by combining the following:

Get the passed/failed indicator for each dimension pathway.

1query listDataQualityDimensions {
2dqDimensionResults(
3 versionSelector: { publishedVersion: true }
4 ) {
5 edges {
6 node {
7 gid
8 publishedVersion {
9 _displayName
10 passedOverallResult
11 }
12 }
13 }
14 }
15}

Get the monitoring projects and catalog items following the configuration details. 

1query listMonitoringProject
2 {
3 monitoringProjects (versionSelector: { draftVersion: false }) {
4 edges {
5 node {
6 gid
7 publishedVersion {
8 __typename
9 name
10 configuration {
11 __typename
12 publishedVersion {
13 items {
14 edges {
15 node {
16 gid
17 publishedVersion {
18 displayName
19 dqChecks {
20 edges {
21 node {
22 __typename
23 gid
24 publishedVersion
25 {
26 __typename
27 displayName
28 mappings {
29 edges {
30 node {
31 __typename
32 gid
33 publishedVersion
34 {
35 catalogItemAttribute
36 {
37 publishedVersion
38 {
39 name
40 }
41 }
42 }
43 }
44 }
45 }
46 }
47 }
48 }
49 }
50 }
51 }
52 }
53 }
54 }
55 }
56 }
57 }
58 }
59 }
60 }

Use these details to collect the results per project / item / check using the dqCheckResultsOverTime query:

1query CheckResults {
2 monitoringProject(gid: "<monitoring_project_gid>") {
3 publishedVersion {
4 dqCheckResultOverTime(
5 selector: { limit: 1 }
6 catalogItemId: "<item_gid>"
7 checkIds: ["<dq_check_gid>"]
8 ) {
9 processingId
10 startedAt
11 results {
12 dqCheckId
13 results {
14 id
15 count
16 name
17 }
18 }
19 }
20 }
21 }
22 }

Combining these three sets can re-create this overview.

The desktop app component uses the same building blocks.


Forum|alt.badge.img+1

Hi ​@RoelantVos, thank you for coming back and sharing the solution here - really helpful for anyone looking to implement a similar reporting 🙌


Forum|alt.badge.img+1
  • Data Pioneer
  • 27 replies
  • July 17, 2025

@RoelantVos /@Cansu I am trying to export the Monitoring Project aggregated result at Catalog Item level. I am able to compute the result at Monitoring Project level, DQ check level but unable to check overall Result on Catalog Item level.

Is there any way to get the overall result at Catalog Item level like we see the report section using desktop tool. The above solution seems to be on rule level. 


Reply


Cookie policy

We use cookies to enhance and personalize your experience. If you accept you agree to our full cookie policy. Learn more about our cookies.

 
Cookie settings