Is there any global setting at Monitoring Project level to get DQ issue detected warning if DQ percentage is less than 95%.?
14.5.3 version, warning seems to be given after below 60%.
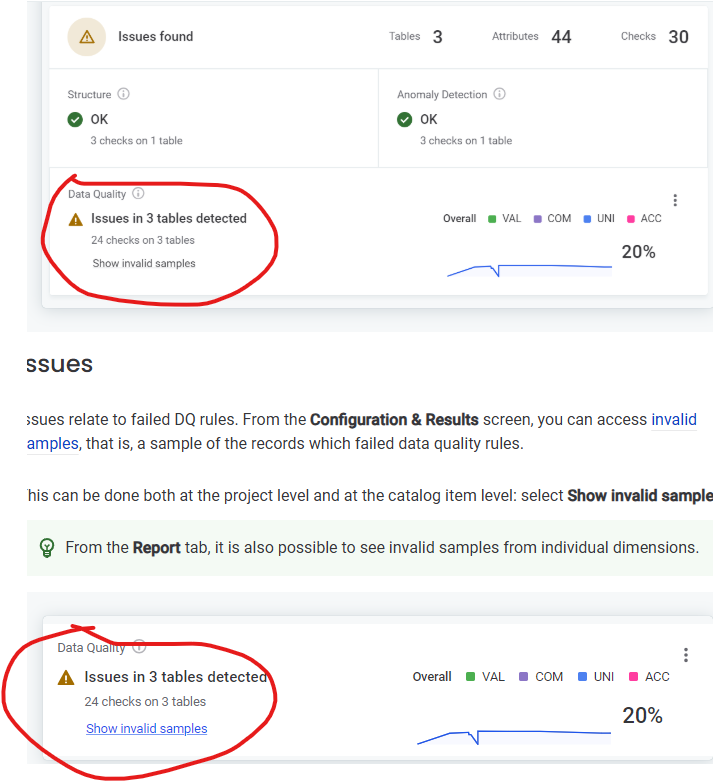
It means that if for catalog item in Monitoring project shows overall data quality less than 95%, it should be shown amber warning. instead of green ok.
Best answer by ekaterina.ponomareva
@akshayl09, I do not think there is any article about this Use Case specifically. The above-shared articles and documentation pages can still be used, as an inspiration and guideline.
In order to update the threshold for all checks in all Monitoring Projects, you will need to first read certain metadata (DQ check and ProjectCatalogItemInstance) and then have a call with POST Method. It can be done with Ataccama Desktop plan. On Ataccama ONE Web portal you would have to do such an update 1 by 1.
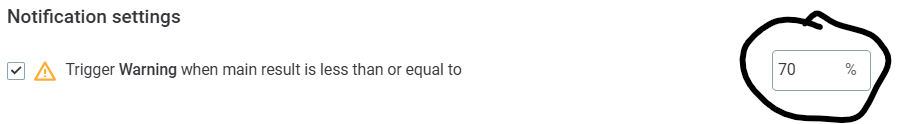
In Ataccama ONE version 14.5.3, the default threshold for data quality (DQ) issue detection is set to 70%. If you want to change the threshold to 95% so that a warning is shown when the DQ percentage is less than 95%, you can adjust the alert threshold settings within the Monitoring Project.
Here's how you can change the threshold:
Navigate to the Monitoring Project: Go to the Configuration & Results tab within your Monitoring Project.
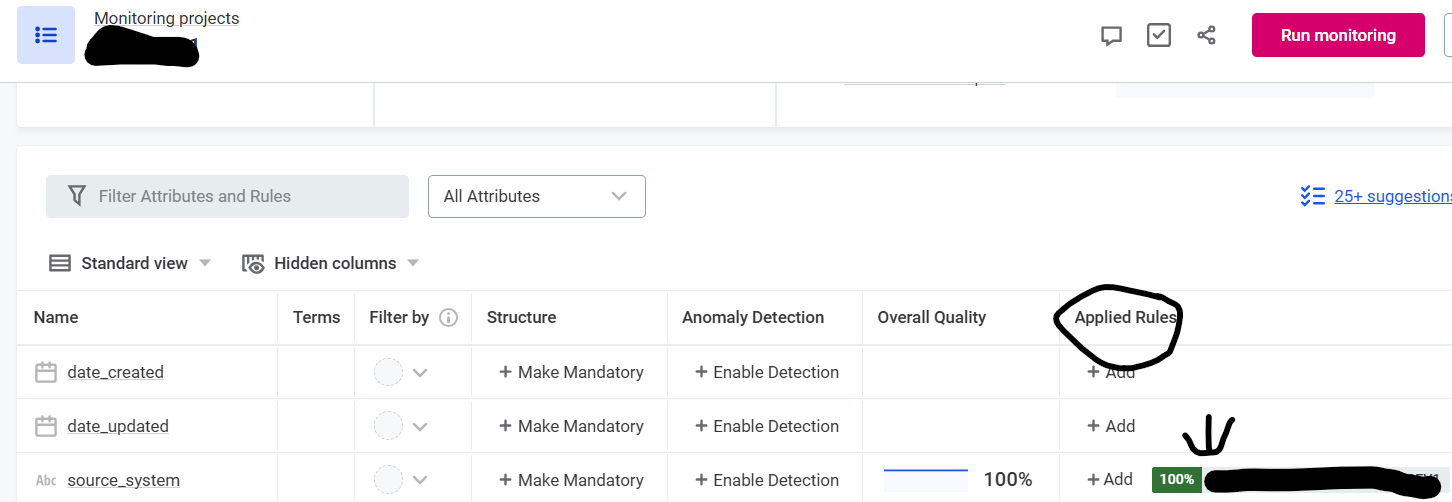
Select the Catalog Item: Open the Catalog Item for which you want to update the DQ check threshold level.
Select the Applied Rule for which you want to update the DQ check threshold level. Click on ‘Configuration’ tab of a Rule. Change the threshold to 95%
If you want to change the default threshold for all items at once, you will need to do it via GraphQL.
@ekaterina.ponomareva Thanks for your reply. This is for notification, but I want to see warning sign when I directly go to monitoring project in amber if the data quality result is below 95%. I would like to set global default setting for below highlighted warning, so that we don't have set manually for each and every catalog item.
Let me elaborate a bit how these warnings work. You would see the warning if at least 1 check is failing below the set threshold. The threshold is set on ‘applied rule’ level, which allows you to make certain checks more important than others, if needed. If you want to set a different threshold, which will be the same for all checks at once, you can do it via GraphQL.
@ekaterina.ponomareva , as threshold is set on applied rule level, do you know what is default threshold applied on all the rules? As I don't see any default configuration at rule level to set the threshold. Where can I find these settings in Ataccama One Web?
I would like to change thresholds for all the rules with one setting instead of doing it for one by one.
The default should be 70%. Please see the first reply with the instruction. I am also pasting additional screenshot pointing to a place where you would see such threshold.
I would like to change thresholds for all the rules with one setting instead of doing it for one by one.
Yes, understood. Please see the above-shared links to understand how to use GraphQL calls to update the threshold for all rules at once. If you would like to find out more about this topic, please also have a look at these posts:
@akshayl09, I do not think there is any article about this Use Case specifically. The above-shared articles and documentation pages can still be used, as an inspiration and guideline.
In order to update the threshold for all checks in all Monitoring Projects, you will need to first read certain metadata (DQ check and ProjectCatalogItemInstance) and then have a call with POST Method. It can be done with Ataccama Desktop plan. On Ataccama ONE Web portal you would have to do such an update 1 by 1.
@ekaterina.ponomareva the above answer is so generic and did not help. Please provide a JSON because we use graphql inspector to capture the JSON, since the configuration of threshold is on pop up window, graphql does not capture it and hence using ONE Desktop is not possible.
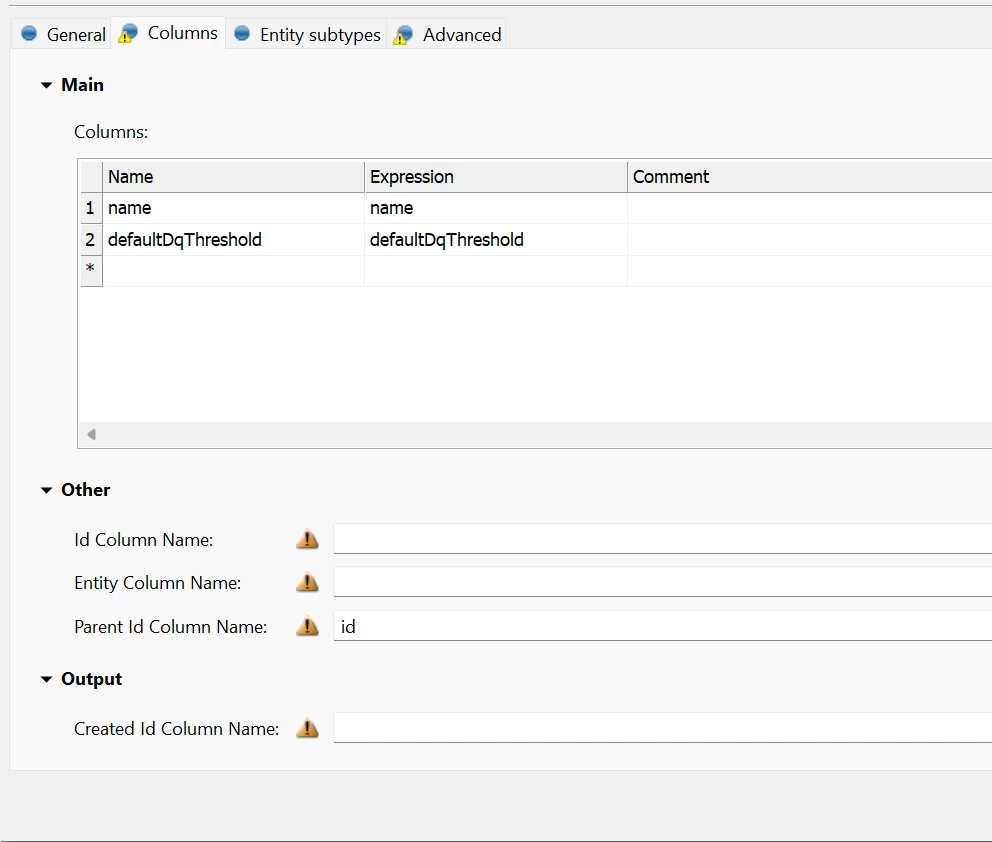
In metadata reader, that is first step, you need create to two values, column Id i.e,”id” and parent Id i.e parent_id and assigned same while writing back. It seems column id is assigned to parent Id. Hence there might be “node not found” error.
you need to assign the variable similar to id.
you need to update defaultDqThreshold with expression given... it can be directly assigned in metadata writer as expression.