


Introduction
We did an internal performance PoC for Streaming. We are reading messages (“msg”) from Kafka or Java messaging service.
Parameters
In order to tune the performance of the streaming we need to modify 2 main parameters on MDM side:
- settings.count = how many messages we need to consume in one single batch
- settings.timeout_s = what is the maximum timeout to wait for this number of messages
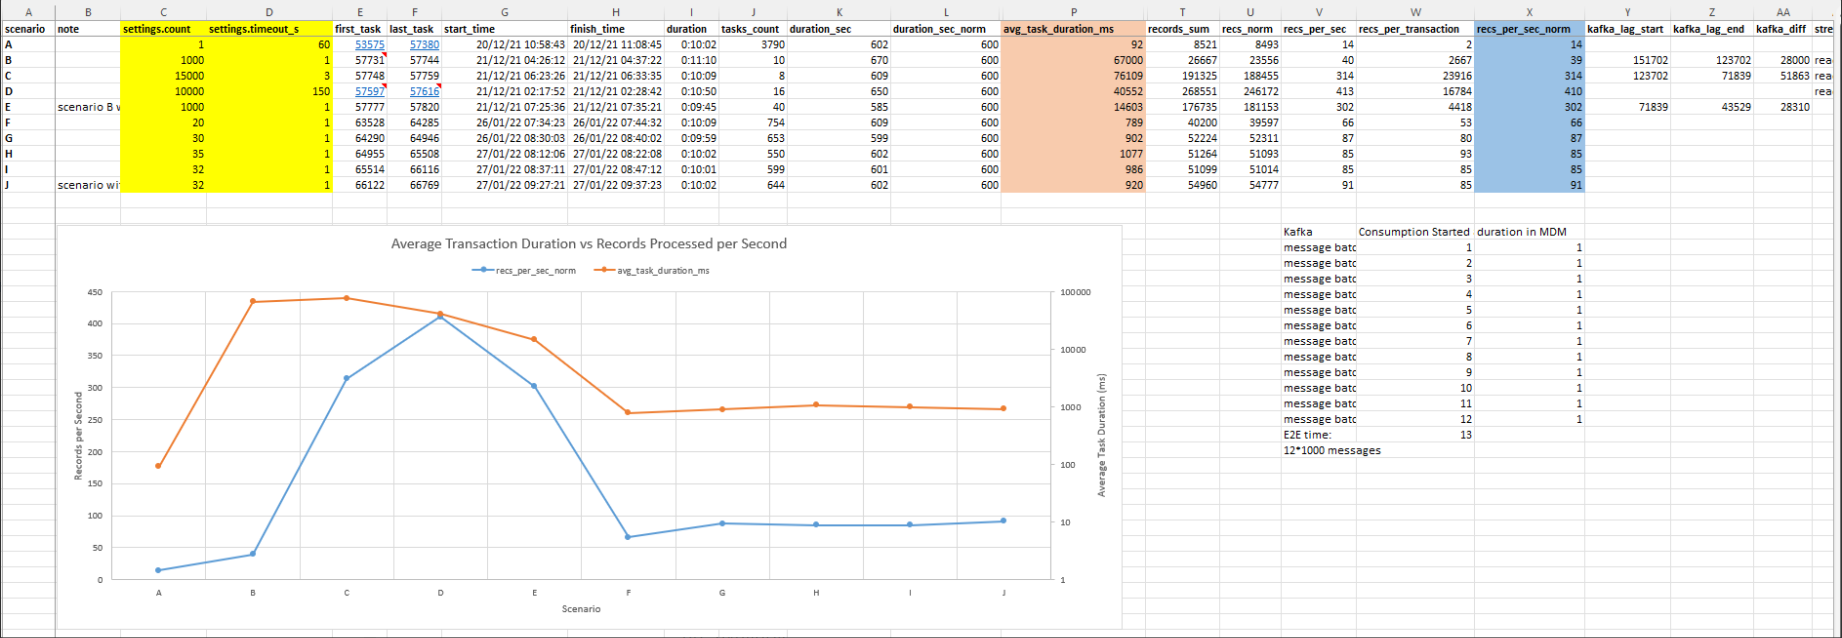
Average duration of the task vs Records per second
We are not aiming for the throughput (records per second) but we are aiming for the average duration of the task. The goal is to run it under 1 sec (1000ms). In various scenarios we have to increase the settings.count parameter starting from 1, 20, 30 etc.
Scenarios
Below are the different scenarios of using different settings for various tasks/transactions in MDM within 10 mins (600sec)
For example of timeout of 1 sec and settings.count = 1000 (scenario  , that means that we try to consume 1000 msg at once within this 1 sec. We will consume whatever we can within the 1sec. What ever is triggered first within the 1 sec it would be consumed and then the processing on the MDM side will be triggered. The 1 sec is the maximum time to wait when fewer messages are available.
Number of processed records
Number of processed records might be larger of the number of input messages. For example 1 msg in the input can produce many records on the MDM side (for example 3 records, party-contact-address). Many records can be consumed on MDM from 1 msg.
Redundant messages
For instance, we have 10 messages from Kafka and maybe 2 or 3 of them would be really consumed (it’s like a huge overhead, we can refer to it as change detection at the msg level) the engine would deduplicate them, virtually increasing the throughput with less work on MDM side for the initial 10 messages.
High settings.count values
The bigger the volume we have on the settings.count (scenario B-E), the better the records per second we get. This is not always the case, example the scenarios below:
- settings.count = 15k recs_per_sec_norm = 314 (scenario C)
- settings.count = 10k recs_per_sec_norm = 410 (scenario D)
Low settings.count values
For lower values on settings.count (scenarios A & F-J), we beat the average duration of the task with less than 1 sec.
Other factors
Always another factor of the performance is the solution itself (complexity of the model/matching rules etc). In other case, for similar exercise after tuning we end up using settings.count = 5k (initially was 10k) and settings.timeout_s = 60.
Parallel settings in Streaming
Delta parallel threshold and delta parallel settings (nme.delta.*) are not applied in the context of streaming.
Whenever we have streaming is not possible to run the delta detection in parallel.
In streaming, we can not run change detection in parallel. The change detection parameters are not applicable in the context of streaming (they are only in the context of batch loads - full/delta/init). If you apply the change detection parallelism settings they do not get triggered in the context of streaming.
We could theoretically have multiple stream consumers (Kafka or JMS) each one of them reading from different sources and we might want to have different settings (message consumption count, different timeouts) which could also benefit from different parallelism settings.
Only nme.consolidation.* and nme.commit.* settings are applied in the context of Streaming. Those settings are global and we can't define different parallelism settings for each consumer.
The load process is slow with enabled parallelism for very few records
In general, with enabled parallelism, the fewer records in the transaction we have, the slower the process is.
If you enable the parallelism, for mdc the master data consolidation part (cleansing, matching, merging) and for the DB the committing part, it is slower with more parallelism than if it runs with a single thread if you have let’s say less than 500 records across all the entities in 1 transaction. So the threshold makes sense.
It is slower because new threads are created in memory, they have to do the job and then they need to get synchronized. However with 1 thread, it’s already created and doesn’t need to sync that much with others.
With DB committing phase: for let’s say 50 records that we have to commit, with 1 thread, it just reads the data and pushes them to the DB and commits in 1 session. For each thread you have to create a session in the DB so there is some overhead in terms of session creation, then each thread needs to read the data from the temp, insert and commit and then they need to sync with the main control thread.
If we have 1000 records the parallelism would have some effect, with 100 records it just slows it down.
Conclusion
Similar to .perf files we have for executing plans we could have something similar for stream consumers, each stream consumer could be different and we might want to tune it differently. We would have to support different parallel settings for each consumer.


