The standard deviation measures the spread of the data about the mean value. It is useful in comparing sets of data which may have the same mean but a different range.
For example, the mean of the following two is the same:
18 19 20 21 22 = 18+19+20+21+22 / 5 = 20
10 15 20 25 30 = 10+15+20+25+30 / 5 = 20
However, the second is clearly more spread out. If a set has a low standard deviation, the values are not spread out too much.
Lets do the calculations outside of ONE Desktop, so we know our expected result.
Example
Find the standard deviation of 4, 9, 11, 12, 17, 5, 8, 12, 14?
First work out the mean: 4+9+11+12+17+5+8+12+14 / 9 = 10.222
Now, subtract the mean individually from each of the numbers given and square the result. This is equivalent to the (x -  )² step. x refers to the values given in the question.
| x | 4 | 9 | 11 | 12 | 17 | 5 | 8 | 12 | 14 |
| (x - )2 | 38.7 | 1.49 | 0.60 | 3.16 | 45.9 | 27.3 | 4.94 | 3.16 | 14.3 |
Now add up these results (this is the 'sigma' in the formula): 38.7+1.49+0.60+3.16+45.9+27.3+4.94+3.16+14.3 = 139.55
Divide by n. n is the number of values, so in this case is 9. This gives us: 139.55 / 9 = 15.51
And finally, square root this: 3.94
Step by Step Guide
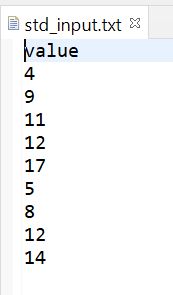
- Prepare a text file containing 1 column consisting of a header record and 9 data records
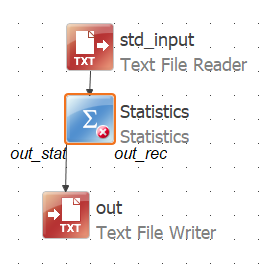
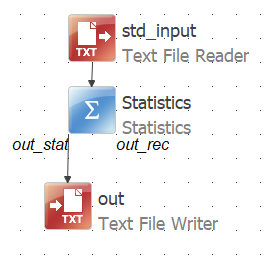
- Create a new plan then add and configure the Text File Reader step configured to read the text file we prepared in step 1.
- Add the Statistics step underneath the Text File Reader step and connect the two steps together.
- Add and configure a Text File Writer step underneath the out_stat node of the Statistics step and connect the two steps together. You plan should look like this;
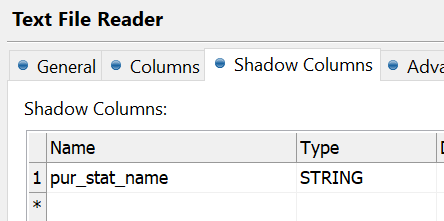
- Add a shadow column into the Text File Reader step. Alternatively you add the column using the Alter Format step. We’ll name this column pur_stat_name and its purpose will be to hold the name of the statistic to which the output value relates.
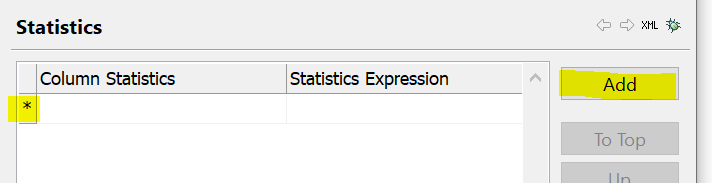
- Go to the Statistics step and add a new statistic row by clicking add or doubling clicking on the asterisk.
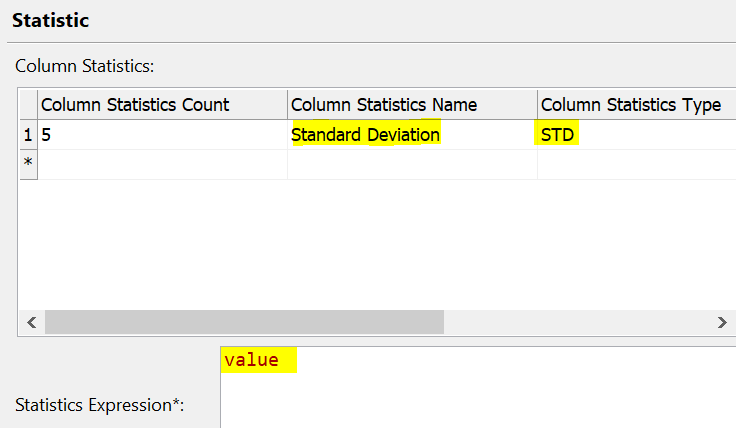
- Fill in the Column Statistics Name, we’ll type the value ‘Standard Deviation’, however you can type whatever is meaningful to you. Also set the Column Statistics Type, we’ll select STD from the dropdown list and finally in the Statistics Expression box at the bottom select our input column
value.
- Click OK, Save the plan and run it. Your plan should look like below with no error or warning icons.
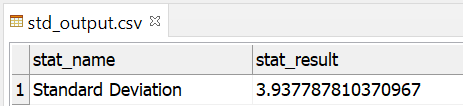
9. The plan should run successfully.
- Open the output text file and review the results.