
Hi everyone!
In this continuation of our best practices post on Monitoring Project Configuration, we will explore additional settings and actions to ensure seamless data quality monitoring.
Check out the part one of the series if you’ve missed it:
Disable Rule Suggestions
Power users can disable rule suggestions in monitoring projects. For more details, refer to the link provided in the text.
Set Partition Defaults
For partitioned tables in monitoring projects, identify them with the provided icon. Define default analysis for partitioned tables using the more options icon and selecting either Last partition analysis as default or Full analysis as default. These settings will be applied when running the monitoring project. See the link provided for more information.
Anomaly Detection
When running anomaly detection during monitoring projects, choose between the time-dependent model or time-independent model. Configure the sensitivity of the detection as well. For further details, check out the link on Anomaly Detection in Monitoring Projects.
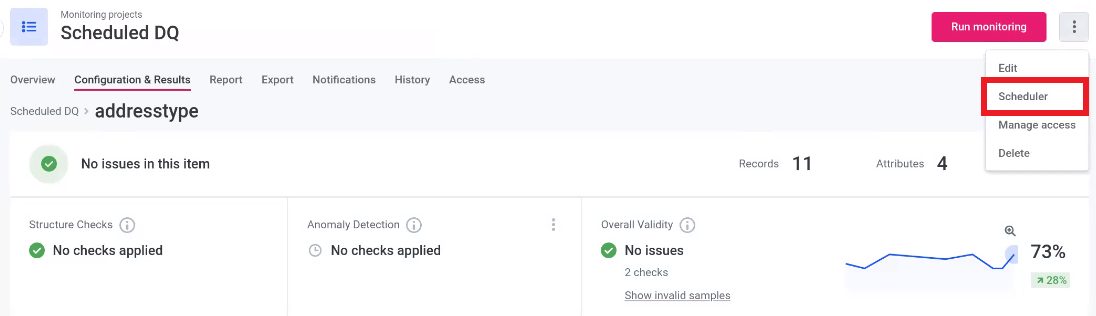
Schedule Monitoring Projects
The scheduler sets the regularity of the monitoring project's execution. To schedule the project, expand the more options menu and select Scheduler. You can create a scheduled event in the Basic or Advanced view, depending on the complexity. Save and publish the changes to schedule the project's execution.
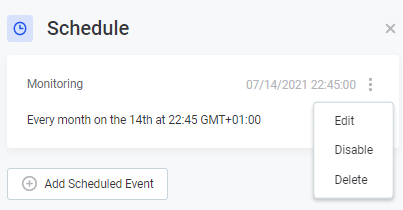
Editing Scheduled Events
Edit, discard, or disable scheduled events by using the more options menu for the event.
Import Configuration
Instead of creating a new project, you can copy the configuration from one monitoring project to another with similar requirements. The copied configuration includes checks, invalid samples, reports structure, and DQ filters. To use the configuration of another project, follow the steps provided in the text.
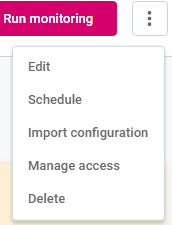
Run Monitoring
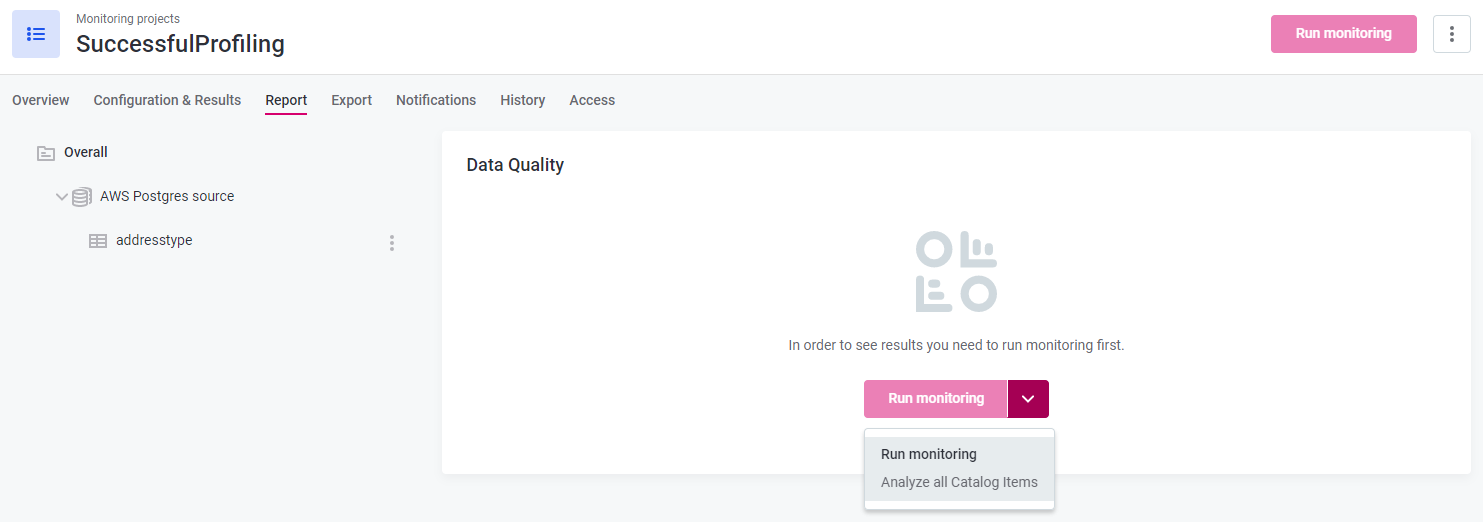
After publishing the project, you can run monitoring by selecting Run monitoring. Alternatively, schedule the project to be run at certain times. Refer to the link on Schedule Monitoring Projects for more information.
You can also run the monitoring and view Data Quality results from the Report tab. If monitoring fails, it could be due to missing connection credentials or limitations in DQ dimension configuration. Check the ONE Troubleshooting Guide for help.
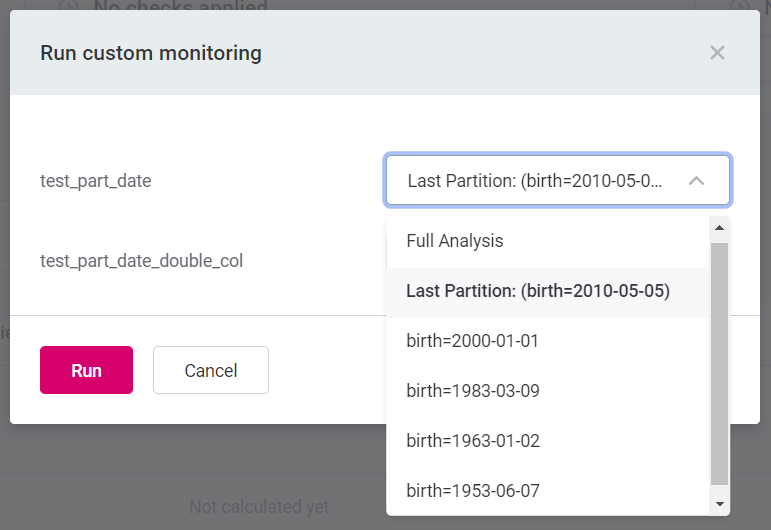
Run Monitoring with Partitions
For partitioned tables, you have two options: Run monitoring and Run custom partition monitoring. The former uses default settings, while the latter allows you to select specific partitions. See the link on Set Partition Defaults for more details.
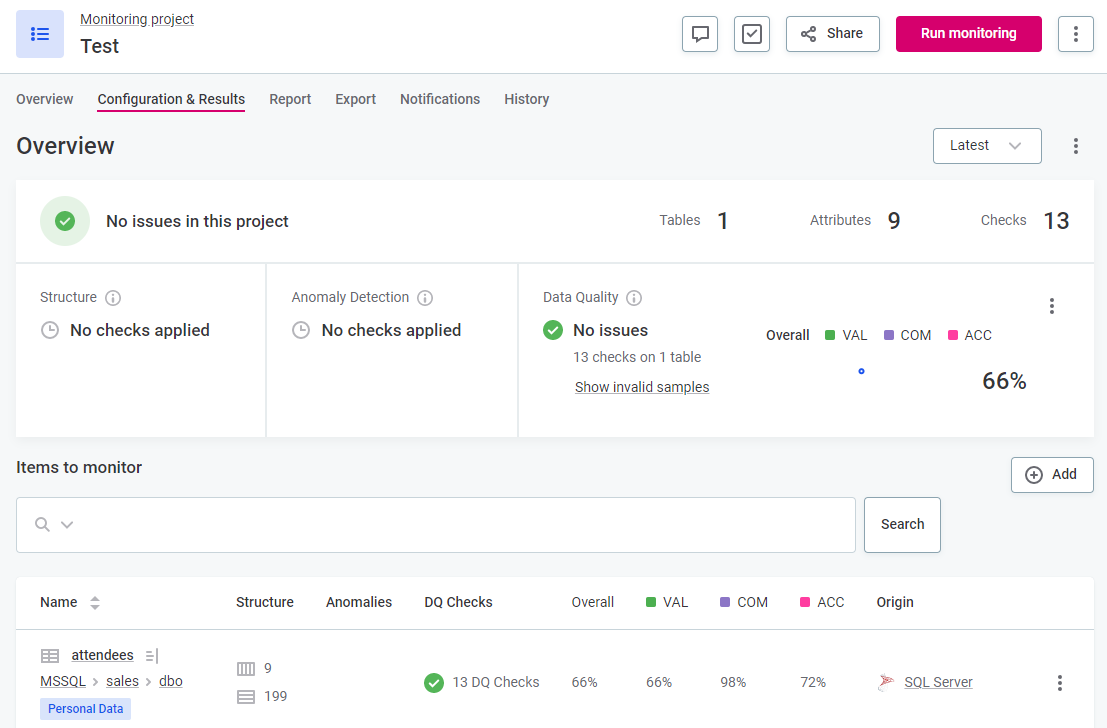
Results
After running a monitoring project, the Configuration & Results tab will display an overview of the results. You can view anomalies, issues, and configure invalid results samples. Export options for post-processing plans are also available.
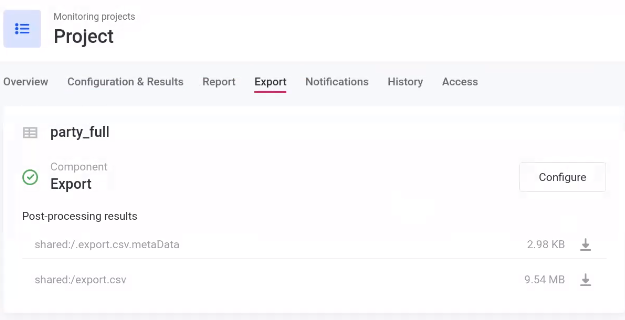
Viewing Individual DQ Scores
Cumulative results of data quality statistics are shown on the Configuration and Results tab. However, to view individual scores for each record, you must export the project.
The last part of the configurations will be on importing! Follow us for more 