


Hello Community!
As part of our ongoing Data Quality Best Practice series, today we'll dive into the world of time series data analysis.
Time series data analysis is a powerful tool that enables you to unlock valuable insights from your transaction data by identifying trends and detecting anomalies. To make the most of this feature, here are some best practices to follow:
Understanding Transaction Data and Time Series Analysis
Transaction data encompasses internal and external events or transactions within a business, often related to financial and logistical records. Common examples include sales orders, invoices, purchase orders, shipping documents, payments, and insurance claims.
The benefits of time series analysis include:
- Visualizing time series data.
- AI-driven anomaly detection.
Keep in mind that time series analysis supports columns with timestamp information, such as DATETIME, DATE, or DAY data types.
Configure and Run Time Series Analysis
To get started with time series analysis:
-
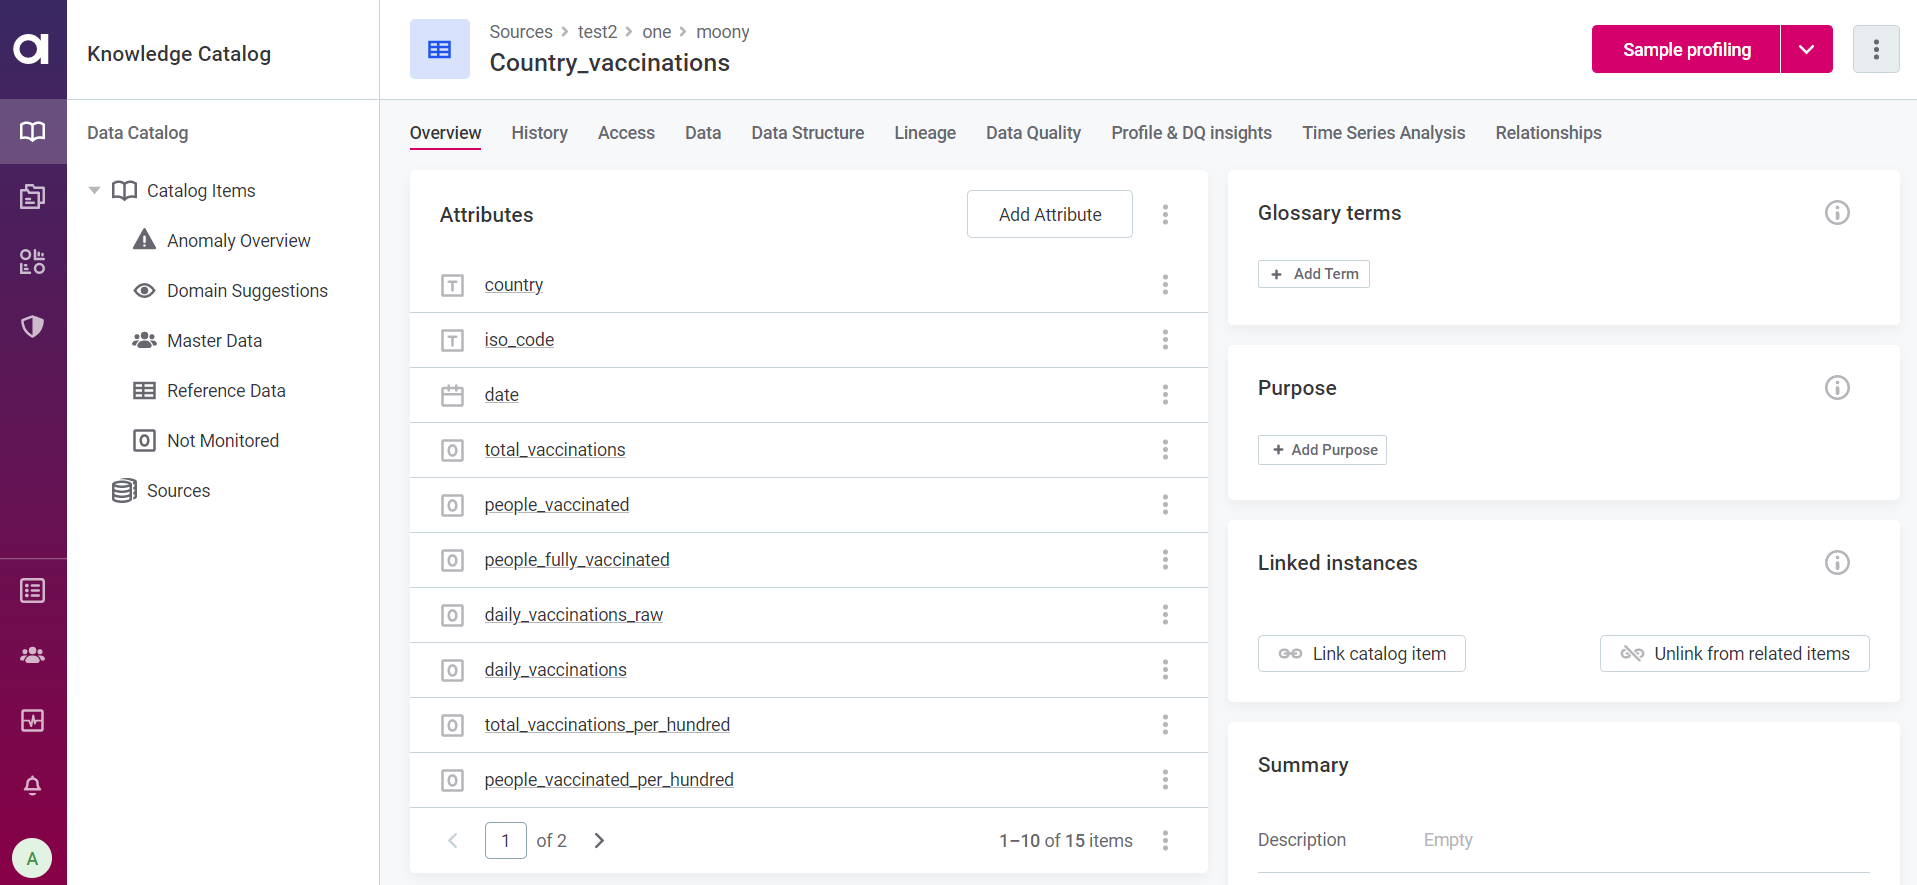
In the Data Catalog > Catalog Items, select the relevant catalog item.
-
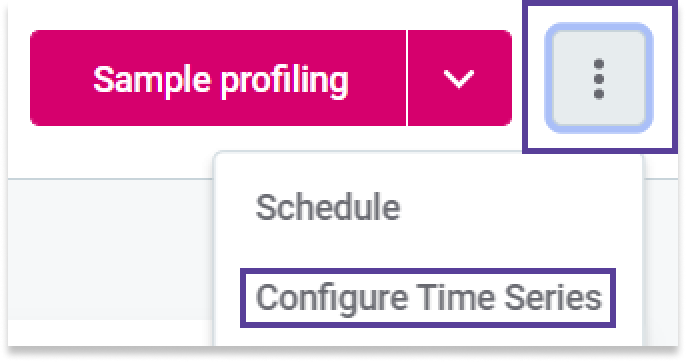
Click the more options icon in the top right-hand corner and choose Configure Time Series.
-
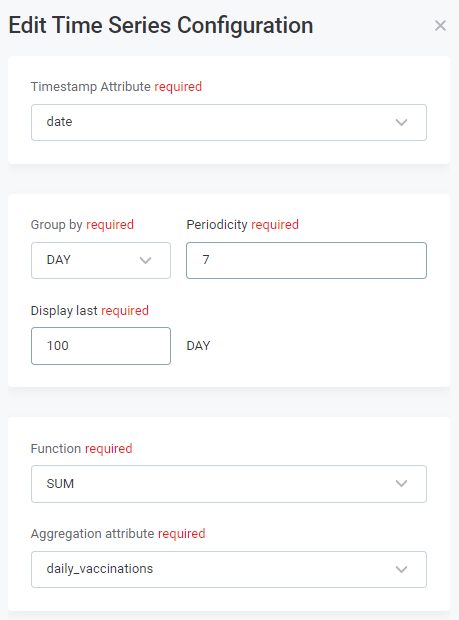
Fill in the required information, including:
- Timestamp attribute: Select the catalog item attribute for time series analysis.
- Group by: Choose how to group the data from the timestamp attribute (e.g., by
HOURorDAY). - Periodicity: This value is generated based on the selected grouping and determines the optimal periodicity.
- Analyse last: Select the window of data to be analyzed (e.g., the last week or two years).
- Function: Choose the aggregate function to be used (e.g.,
SUM,COUNT,AVG,MIN, orMAX). - Aggregation attribute: Specify the attribute to aggregate (e.g., hourly sales data).
- Anomaly detection sensitivity: Select the desired level of sensitivity for anomaly detection.
-
Once configured, click Save and Run.
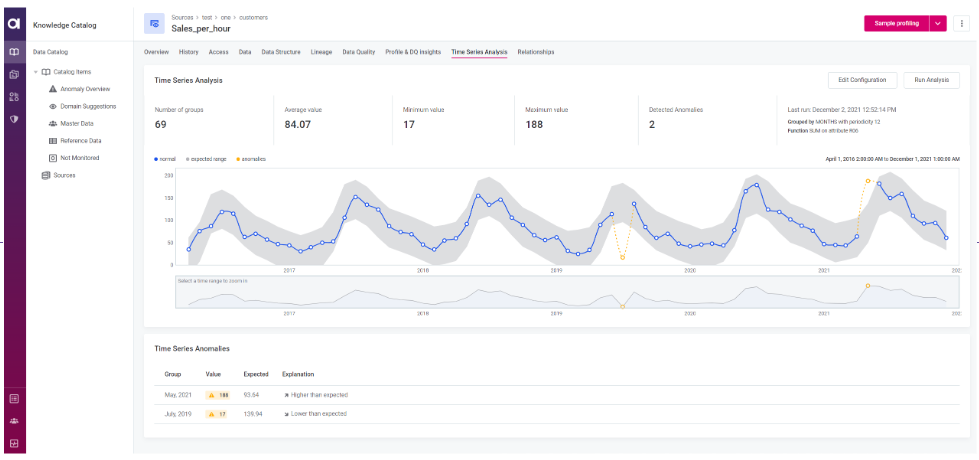
Interpreting Time Series Results
The outputs of time series analysis can be found under the Times Series Analysis tab of the catalog item and include:
- Key metrics of the data:
Number of groups,Average value,Minimum value,Maximum value. - A graph displaying the data points, including anomalies and the expected range.
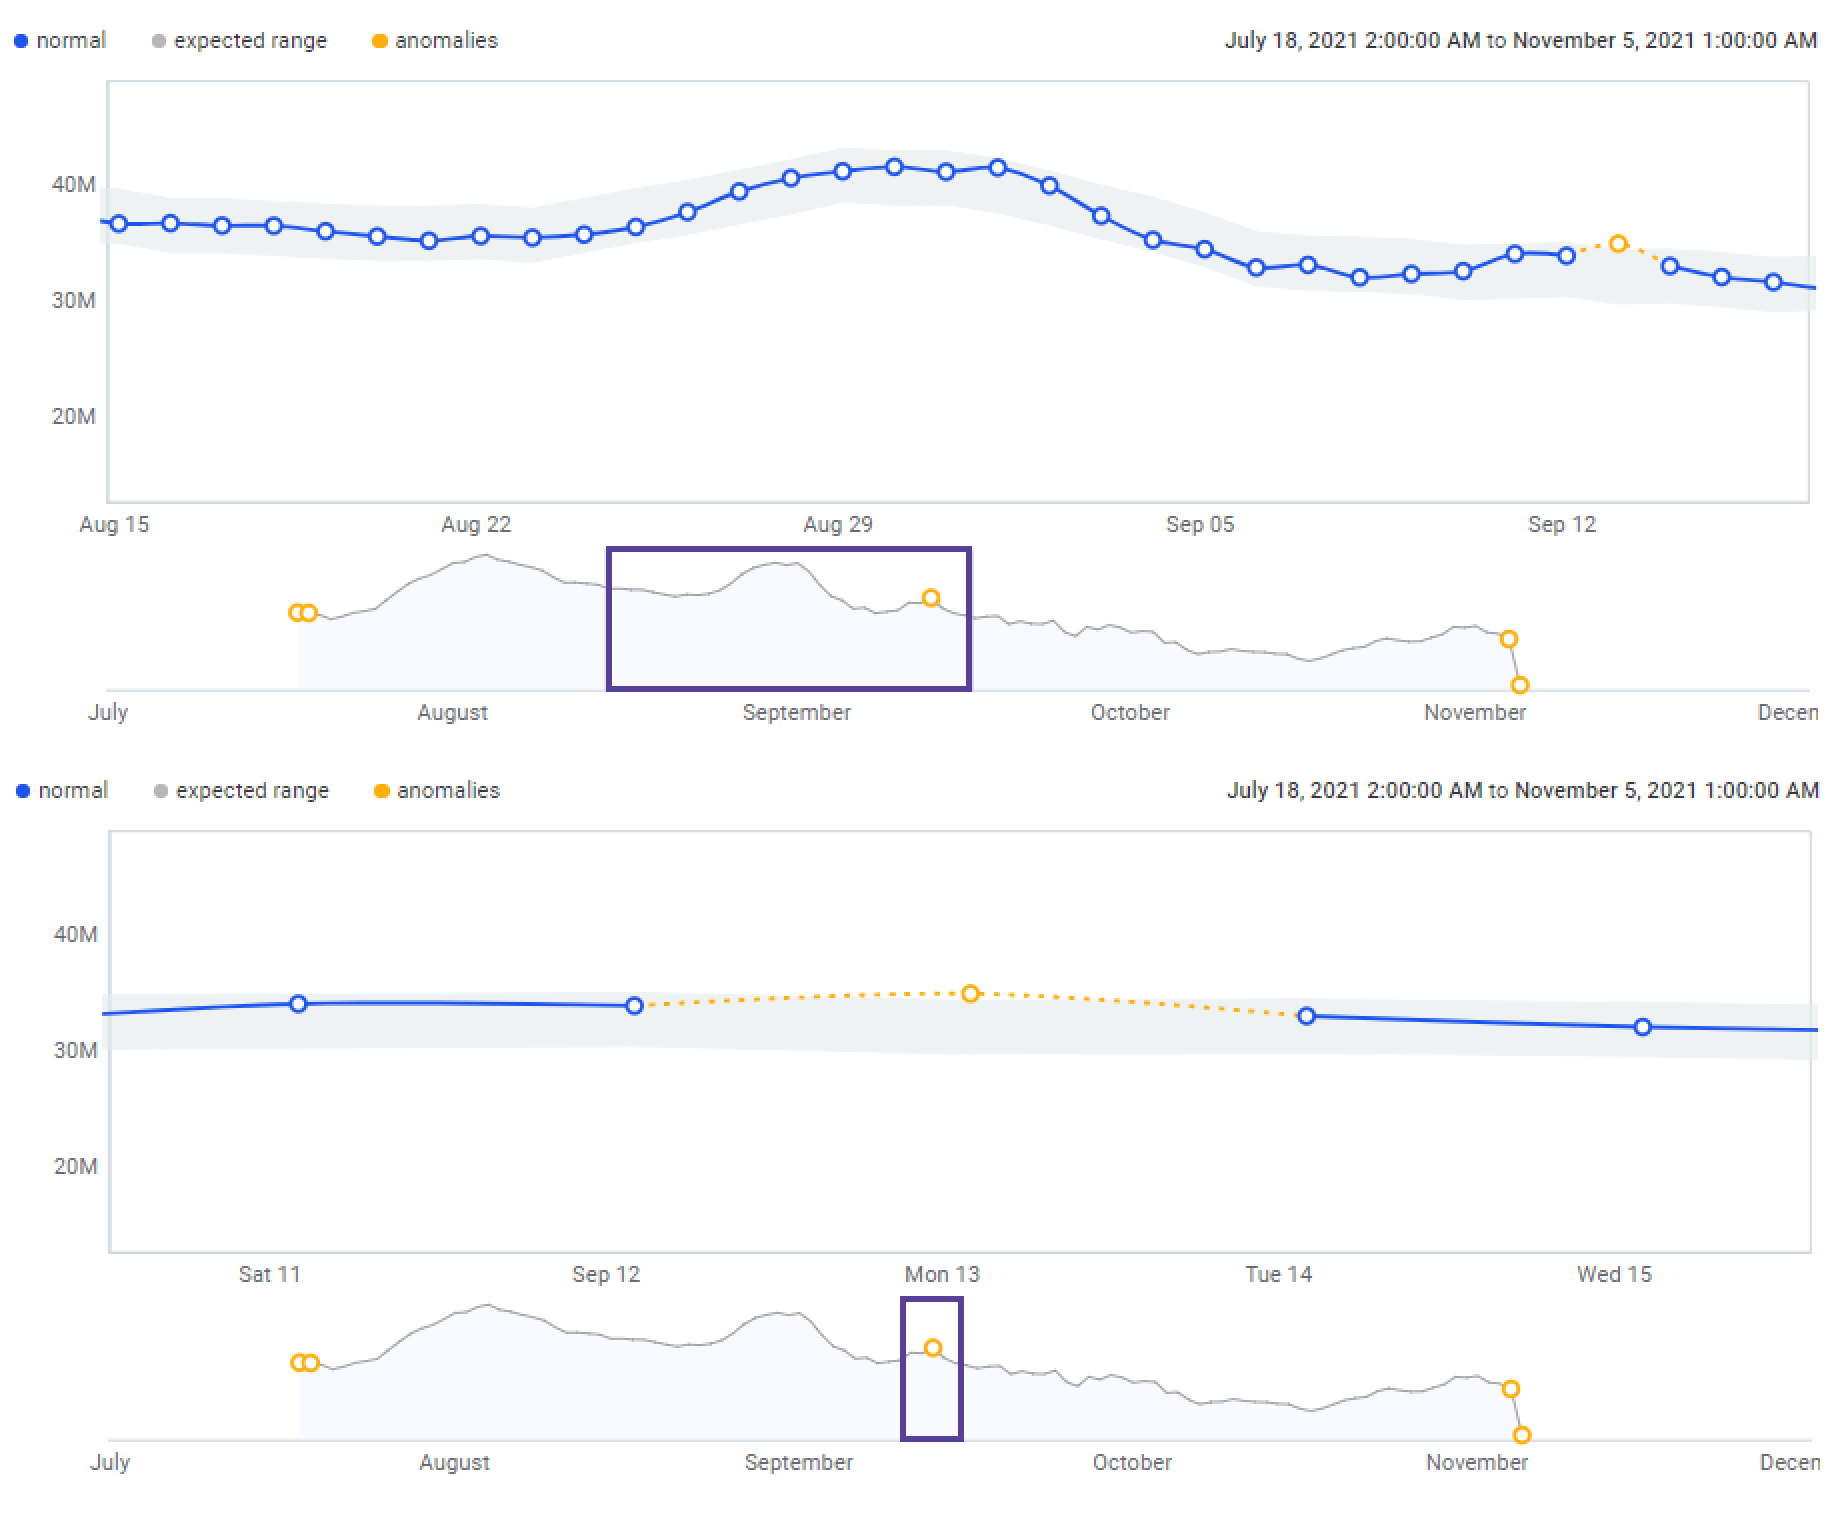
- A list of anomalies, if detected, under Time Series Anomalies.
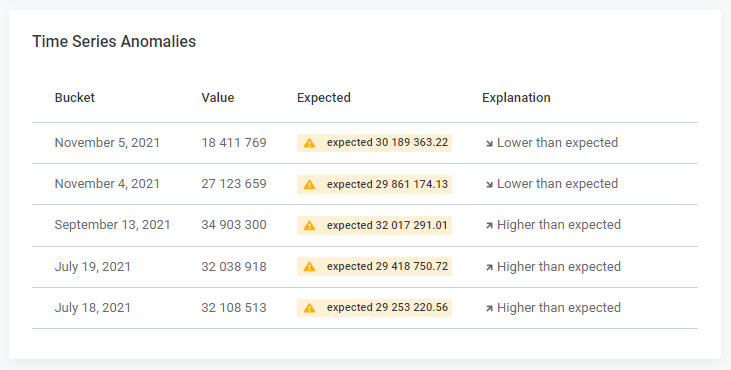
🧠Keep in mind that anomaly detection may not be available if there aren't enough data points in the chosen time series configuration. Ensure you have a sufficient number of data points for accurate results.
By following these best practices, you'll be equipped to leverage time series data analysis effectively. Feel free to explore the potential of this powerful feature and share your insights with the community ☀️
If you have any questions feel free to share them in the comments!


