


Hi Community!
Are you looking to retrieve Data Quality (DQ) results from monitoring projects or catalogs using Ataccama's ONE Desktop? We have created a set of easy-to-follow steps to help you achieve this efficiently. These steps will mimic the API calls created for the same purpose and return DQ results. Let’s get into it 🔮
Prerequisites
Before diving into the process, make sure you have the following prerequisites in place:
-
Active Server Connection: Ensure you are connected to the ONE Web Application.
-
Input Data: You need the data for which you want to retrieve results. You can use either the appropriate Input step or the MMM Reader step. You can add input data by dragging and dropping files onto the canvas or by configuring the steps manually. If multiple input steps are required, use the Join step and create connections accordingly.
Note: Depending on the step you wish to use to retrieve results, different parameters will be required in the input. Refer to the individual step information for mandatory inputs.
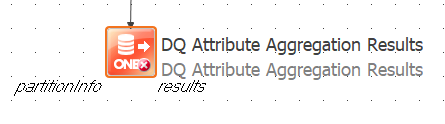
DQ Attribute Aggregation Results
This step returns results of certain DQ aggregations for attributes.
-
In your Input step, ensure you have mappings to ONE Web Application for all required parameters and optional parameters as desired:
Example: To map the new step to catalog ID information, you can configure the MMM Reader with Entity Type:
Catalog Itemand Id Column Name:catalogItemId.- Attribute ID (mandatory): List of attribute IDs, each with an optional list of aggregation IDs (aggregation IDs can be, for example, the ID of a dimension).
- Catalog Item ID (mandatory): Catalog item ID.
- Limit and time ranges: Optionally define the number of runs to be returned, as well as a start and end date for the time range.
-
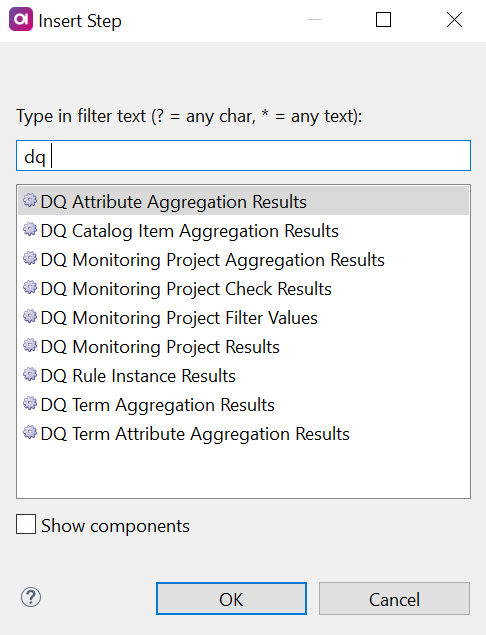
Add the DQ Attribute Aggregation Results step to the canvas.
-
Create a connection to DQ Attribute Aggregation Results from the input step (or from the join step if multiple inputs are used).
-
Double-click on the DQ Attribute Aggregation Results step and navigate to the Properties tab:
- Add the IDs of the corresponding columns from the input in the available fields:
- Attribute Id (mandatory): Column from previous steps in the flow mapped to the attribute ID information.
- Catalog Item Id (mandatory): Column from previous steps in the flow mapped to the catalog item ID information.
- Aggregation Id: Column from previous steps in the flow mapped to the aggregation ID information.
- Limit: Column from previous steps in the flow mapped to limit definition.
- Time Range From: Column from previous steps in the flow mapped to the start date of the specified time range.
- Time Range To: Column from previous steps in the flow mapped to the end date of the specified time range.
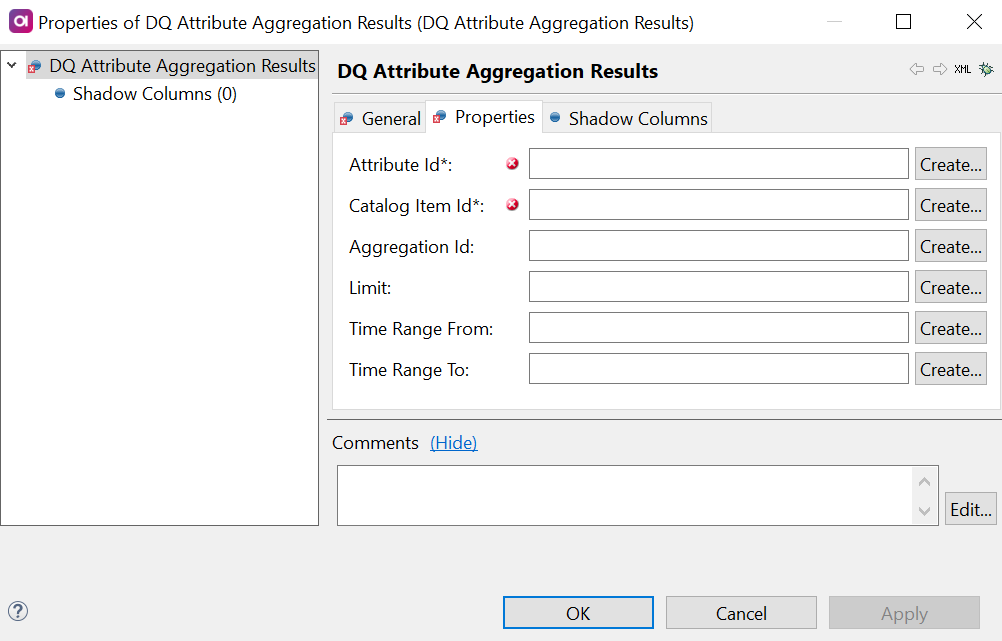
- Alternatively, select Create... to create a shadow column in the previous step in the flow and map this field to that column.
- Add the IDs of the corresponding columns from the input in the available fields:
-
(Optional) Define shadow columns to create a new column of a specific type in the output format. This column can contain initial data as a result of a Default Expression.
This step has two outputs by default: partition information and results. You can remove connections as needed if you don't require a particular output.
DQ Monitoring Project Aggregation Results
Retrieve aggregations for monitoring projects using this step:
- Configure the Input step, mapping Monitoring Project ID, Catalog Item ID, Aggregation ID, and time ranges.
- Add the DQ Monitoring Project Aggregation Results step.
- Establish a connection between the Input step and DQ Monitoring Project Aggregation Results.
- Set properties for the DQ Monitoring Project Aggregation Results step, mapping relevant columns.
- Optionally, define shadow columns for customized output formats.
- Optionally, define attribute filters to further refine your results.
This step offers various outputs by default: alerts, explanations of invalidity, and results. Customize your outputs as needed.
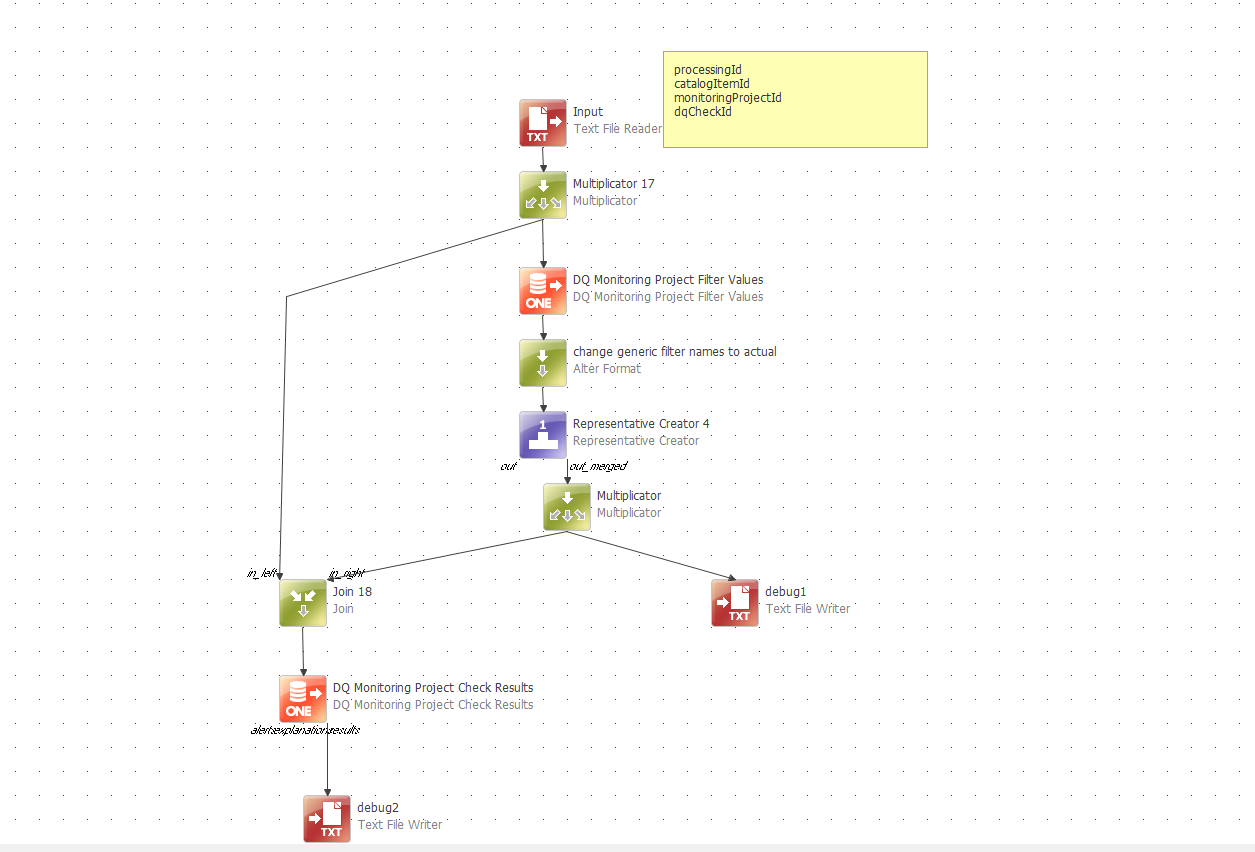
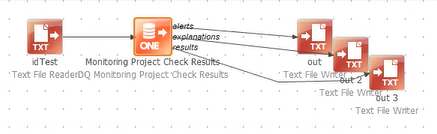
DQ Monitoring Project Check Results
This step returns results of certain aggregations (custom, catalog item level, attribute level).
-
In your Input step make sure you have mappings to ONE Web Application for all required parameters, and optional parameters as desired:
- Monitoring Project Id (mandatory): monitoring project IDs.
- Catalog Item ID (mandatory): list of catalog item IDs (not the id catalog item instance).
- DQ Check ID (mandatory): list of DQ check IDs.
-
Limit and time ranges: optionally define the number of runs which should be returned and a start and end date of time range.
- Add DQ Monitoring Project Check Results step to the canvas.
- Add an connection to DQ Monitoring Project Check Results from the input step (or from the join step if multiple inputs are used).
-
Double-click on the DQ Monitoring Project Check Results step and in the Properties tab:
-
Add the IDs of the corresponding columns from the input in the fields available:
- Monitoring Project Id (mandatory): column from previous steps in flow mapped to the monitoring project ID information.
- Catalog Item Id (mandatory): column from previous steps in flow mapped to the catalog item ID information.
- DQ Check Id: column from previous steps in flow which is mapped to DQ check ID information.
- Limit: column from previous steps in flow which is mapped to limit definition.
- Time Range From: column from previous steps in flow which is mapped to start date of specified time range.
- Time Range To: column from previous steps in flow which is mapped to end date of specified time range.
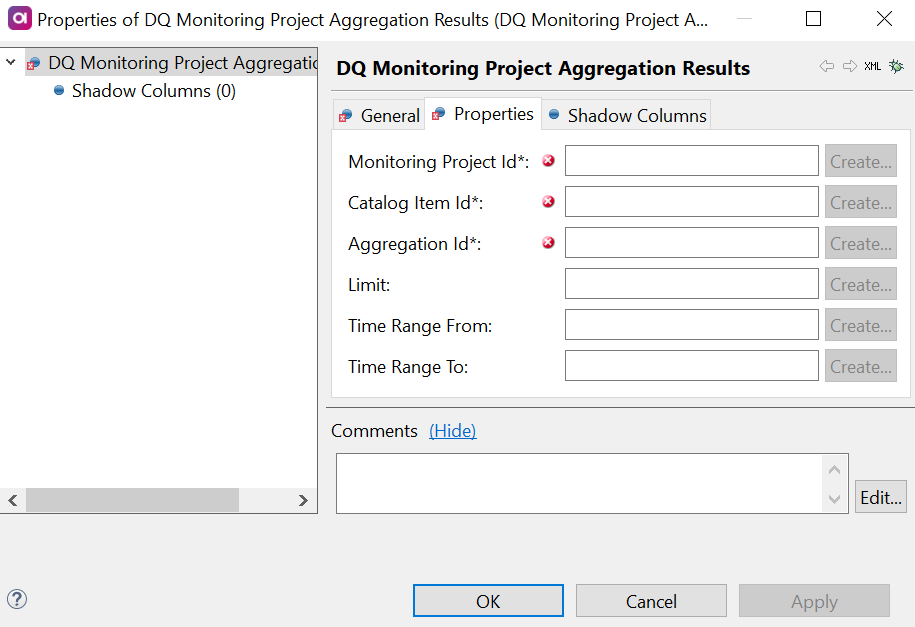
- Alternatively, select Create... to create a shadow column in the previous step in the flow and map this field to that column.
-
- (Optional) Define shadow columns to define a new column of a specific type in the output format. The created column can contain initial data as a result of
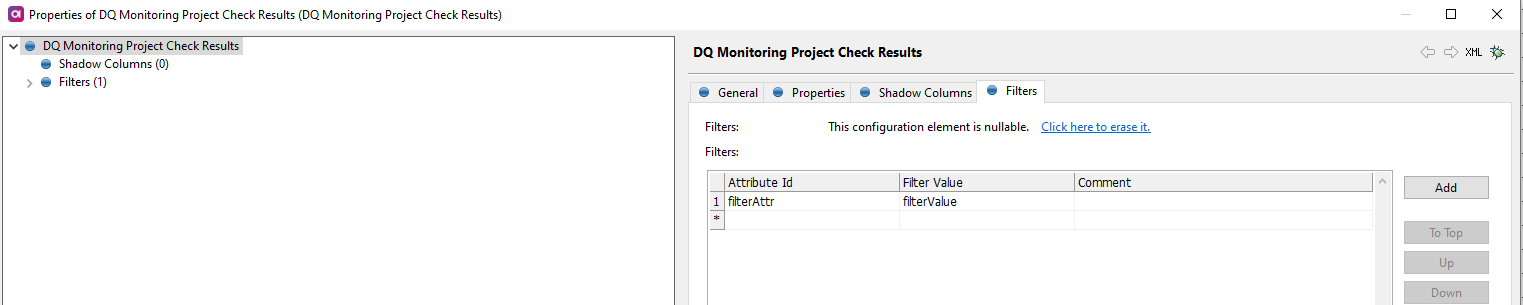
Default Expression. - (Optional) Define attribute filters to filter project results and project aggregation results. To do this:
- Select the Filters tab and create a new configuration
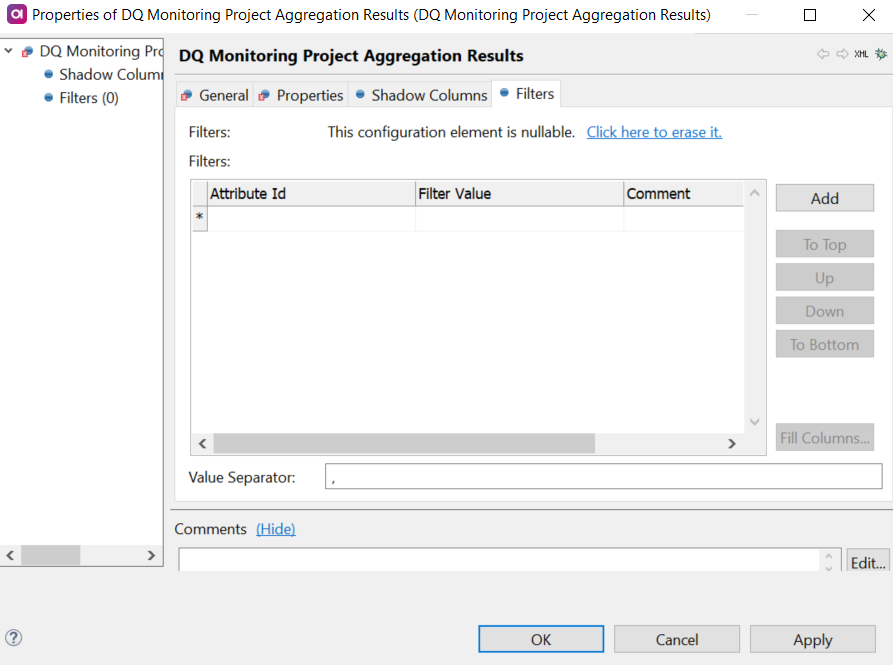
- In Attribute Id, provide the ID of the attribute you would like to be able to filter by.
-
In Filter Value, add the attribute values you would like to be able to select in the filter. You can only add values which are present in the selected attribute.
When adding multiple values, the separator is comma by default. This can be changes by changing the entry in Value Separator.
- Select Add to add another attribute filter and repeat steps 6a-6,c or select OK if you are done.
- Select the Filters tab and create a new configuration
This step has three outputs by default: alerts, explanations of invalidity, and results. Remove connections as required if you do not want a particular output to be created.
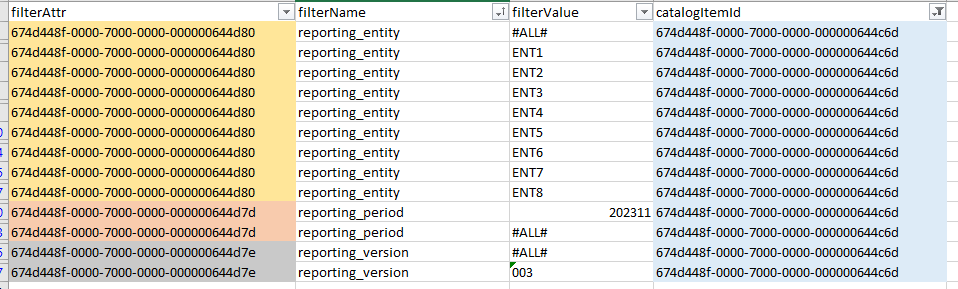
DQ Monitoring Project Filter Values
Retrieve data values of filter attributes using this step:
- Configure the Input step, mapping Monitoring Project Processing ID and Catalog Item ID.
- Add the DQ Monitoring Project Filter Values step.
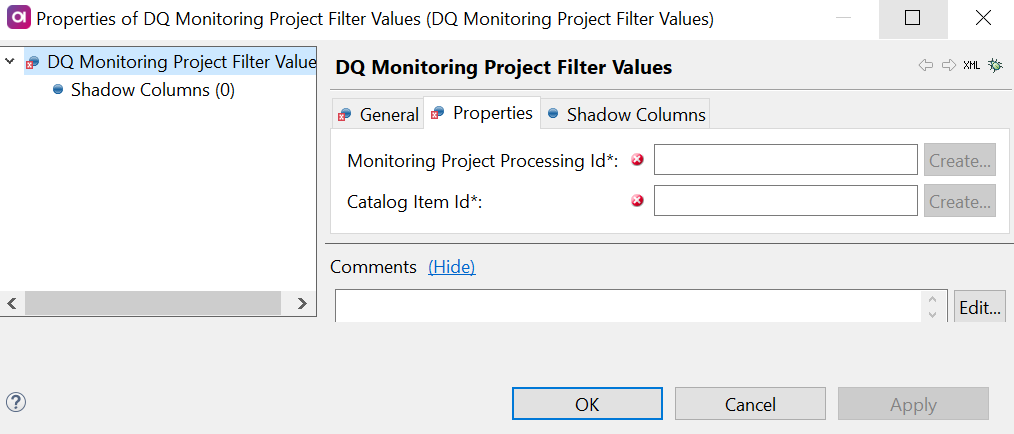
- Establish a connection between the Input step and DQ Monitoring Project Filter Values.
- Set properties for the DQ Monitoring Project Filter Values step, mapping relevant columns.
- Optionally, define shadow columns for customized output formats.
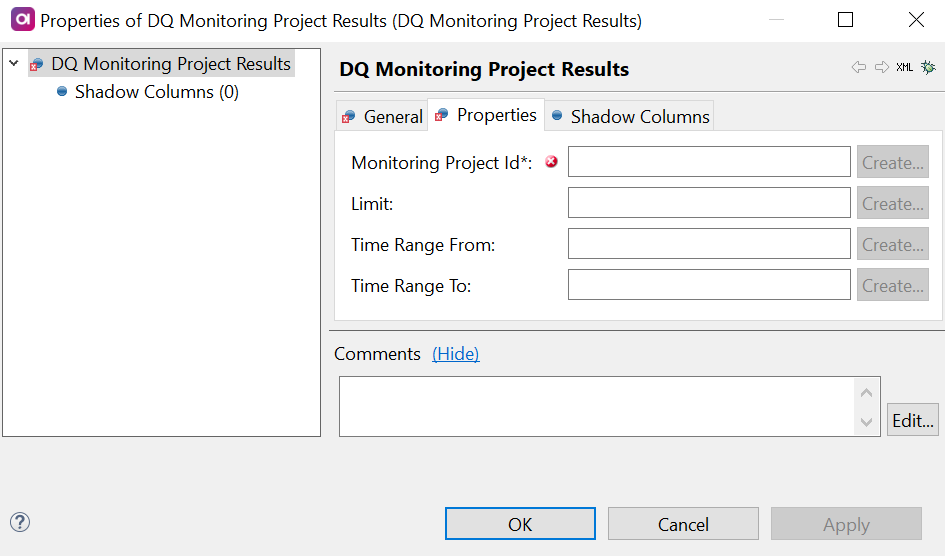
DQ Monitoring Project Results
Retrieve project validity results over time with this step:
- Configure the Input step, mapping Monitoring Project ID and time ranges.
- Add the DQ Monitoring Project Results step.
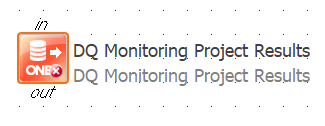
- Establish a connection between the Input step and DQ Monitoring Project Results.
- Set properties for the DQ Monitoring Project Results step, mapping relevant columns.
- Optionally, define shadow columns for customized output formats.
-
This step provides three outputs by default: alerts, explanations of invalidity, and results. Customize your outputs based on your requirements.
-
Optionally, define shadow columns for customized output formats.
- Optionally, define attribute filters to refine your results.
By following these best practices, you can efficiently retrieve DQ results for attribute aggregations in Ataccama's ONE Desktop.
Stay tuned for more best practice posts for other DQ results retrieval steps!