


📌 Links to the legacy documentation portal are no longer available. Read about the changes and how to access our documentation here.
Hi there!
Lisa from Ataccama here. I’m a Solution Consultant and I love exploring the different ways our platform can become part of the business and technology ecosystem for our customers.
In this post, I will share a framework for integrating Ataccama with a work management or issue tracking software like Jira. Delivering data quality insights and alerts from Ataccama to an issue tracking tool can help to maintain transparency and accountability, and to facilitate cross-functional team work. Let’s explore an example!
Use case
Ataccama’s Data Quality Monitoring Projects are a powerful tool for regular data quality evaluation and reporting on the results. You can configure DQM Projects to run periodic evaluation of data against DQ Rules, and provide various insights to the business. Do you need to send a digest whenever fresh DQM results are ready? Or do you need to generate alerts when specific DQ rules fail, or when the data quality results fall under a certain threshold? Once you’ve decided what kind of alerts are important for your organization, you can implement the logic to get the necessary details from Ataccama and push them to a third-party software via API, where business users can pick them up and follow up with the appropriate visibility throughout the organization.
Solution
To deliver alerts from Ataccama to another platform, we’ll build a notification-based workflow and deploy it on the Ataccama Server. Let’s visualize the solution first.
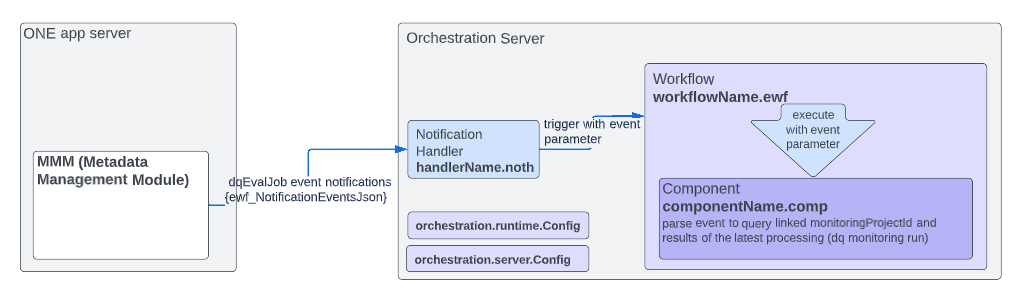
On the ONE app server, the MMM is the module that holds all metainformation about the target operational and analytical environment and provides support for all data-related actions. When a DQ Monitoring job (dqEvalJob) is executed by the platform, the MMM stores the metadata about the entities concerned, their relationships and the results. That works out of the box without any additional configuration - we just need to choose which metadata entity we’ll work with (in this case, dqEvalJob).
The Orchestration Server, or the Ataccama Online Server, is where we’ll build the integration.
This article is a cheat sheet covering the key elements of the configuration, so it does skip on the finer details. Don’t hesitate to follow the cross-links to learn more about the artefacts you haven’t used before.
Note that in this piece we assume an on-premises installation of Ataccama.
Configuration
1. Notification Handler
The Notification Handler subscribes to notifications about dqEvalJob events from the MMM. When receiving a notification, the Notification Handler gets a variable events which it then passes to the Workflow.
Our Notification Handler is a .noth file that looks something like this:
<?xml version='1.0' encoding='UTF-8'?>
<notificationHandler>
	<description>Invoke DQ results extraction when monitoring job FINISHED notification is received</description>
	<enabled>true</enabled>
	<job workflow="WF1:extract_dq_results.ewf" class="com.ataccama.adt.scheduler.job.WorkflowJob">
		<variables>
			<variable name="events" value="${ewf_NotificationEventsJson}"/>
		</variables>
	</job>
	<serverName>ONE</serverName>
	<subscription ackLimit="5" entityType="dqEvalJob" excludeOwnModifications="false"/>
</notificationHandler>
Note that value for the workflow parameter must match the name of the .ewf file you’ll create in Step 2.
The value of the serverName parameter must match the name of the server defined in your .runtimeConfig file in Step 5.
We’ll deploy the .noth file to the following directory on the Orchestration Server: <PROJECT>/notifications/handlers/DqEvalEvent.noth
2. Workflow
Once invoked by the Notification Handler, our Workflow will trigger a Component and pass the values of the events variable (received from the Notification Handler) to the Component in a parameter called event.
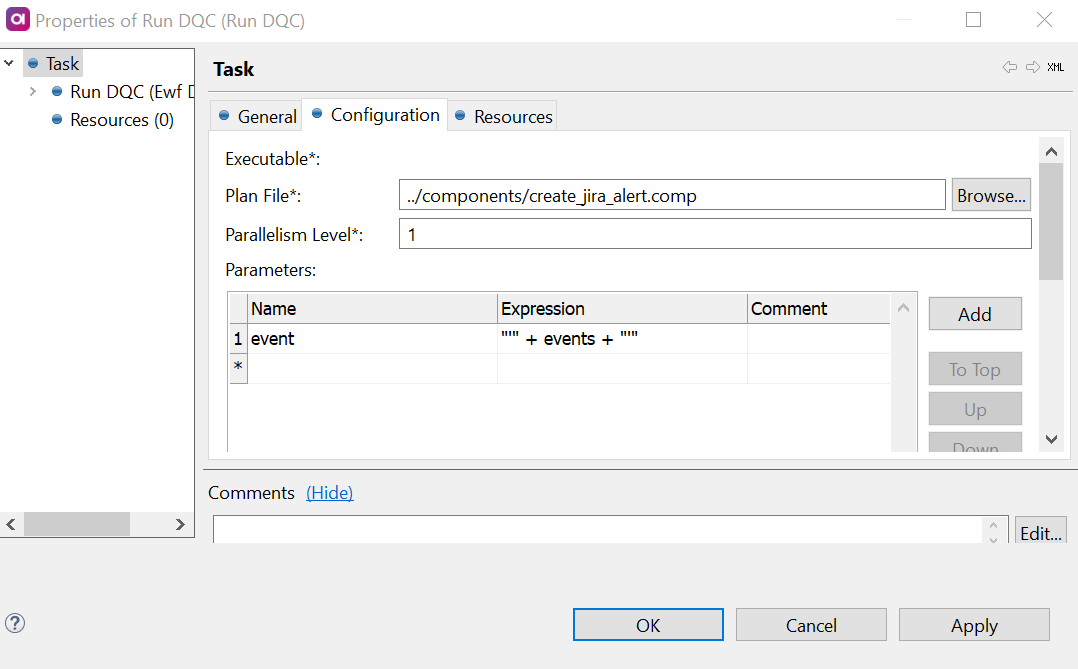
Our workflow is an .ewf file with a single task Run DQC, configured to point to the appropriate .comp file and to pass the event parameter from the input variable events.
👉 Don’t forget to define the input variable events in the workflow properties.
The .ewf file will be deployed in the following path: <PROJECT>/workflows/extract_dq_results.ewf
3. Component
From the event parameter, the Component logic can parse out the details related to the specific dqEvalProjectJob which triggered the event notification. For that to work, event should be mapped as a parameter in our .comp file.
We can feed the job’s id to a ONE Metadata Reader step in the Component and get the id of the DQM Project in question from the MMM. Using the appropriate step(s) from the gallery, we can then get DQ Monitoring results at the granularity level we need for our use case.
👉 To use a DQ Results step, additional parameters will be required, such as catalogItemId, dqCheckId, monitoringProjectId, etc. To get the metadata of the required entities and feed them into the component’s logic, use additional ONE Metadata Readers.
Once we have the DQ results we’re interested in, we can generate the attributes for the action item in the target system, for example the task name, task assignee, task description, tags, etc. - based on the details of the Monitoring Project, DQ Rules, evaluated attributes, validity results, etc. We’ll pass these parameters to a JSON call step in our Component which will make an API call to the target system to create the item.
👉 Here’s a great article on working with the Jira API and setting up the JSON call step:
The .comp file should be deployed in the following path: <PROJECT>/components/create_jira_alert.comp
4. Sever Configuration
For our .noth and .ewf files to work when deployed on the Orchestration Server, the .serverConfig file needs the appropriate components, namely the NotificationHandlerServerComponent and WorkflowServerComponent.
👉 This guide on configuring the Server is an excellent place to start if you haven’t worked with the Orchestration Server before.
The file should be deployed to <RROJECT>/etc/orchestration.serverConfig
5. Runtime Configuration
In the .runtimeConfig file on the server, we will define the contributedConfigs so that the server can connect to the required external resources:
UrlResourceContributorto point to the target system to which we’ll make an API call:
<config class="com.ataccama.dqc.processor.support.UrlResourceContributor">
<urls>
<url name="TargetSystem" url="https://target-system.atlassian.net/rest/api/2">
<authConfig password="<encypted_password>" class="com.ataccama.dqc.processor.bin.config.auth.BasicAuthConfig" user="email@company.com"/>
</url>
</urls>
</config>
-
S3Contributor to point to the MinIO storage.
-
One2Contributor to point to the ONE Platform and its MMM module.
The .runtimeConfig will be deployed to <PROJECT>etc/orchestration.runtimeConfig
After deploying Server and Runtime Configuration files, we will restart the Orchestration Server. That’s it - we’ve just configured the integration. Let’s try it out!
Testing the workflow
The Workflow will be invoked automatically by the Notification Handler when a Monitoring Project evaluation job runs on Atacama ONE.
To test the setup, go to your ONE Web App and click Run monitoring on one or more of your Projects. Once the data quality results are ready, they will be evaluated by the component logic, and if the conditions you set are satisfied, you should see the expected item(s) pop up in the target system.
Need to troubleshoot? From your Orchestration Server’s Admin Console you can check:
- The status of the Notification Handler (Workflows > Notifications in the left-hand menu) - is it
enabled? - The status of the Workflow execution (Workflows > Configurations in the left-hand menu) - is it
FINISHED_OK? - The logs from the Workflow execution - are there any errors?
Ready to give this a go? Or are you already using a different approach to integrating Ataccama with your systems? Let us know in the comments!


