Summary of DQ Checks and Results in Ataccama ONE Desktop
Hi
I would like to get a summary of DQ checks and results like the one we have in ONE web like how many in % and count of broken rules, how many are passing and how many records do we have in total etc. in Ataccama ONE desktop. I tried looking out any related topic in the community but I could not find one. Is it possible to achieve this via Ataccama ONE desktop as we have an existing plan comparing data fields in two different sources. Do you mind sharing the suggested steps to achieve this? Thanks in advance!
Page 1 / 1
Hi @Radziah ,
You can export the results from the one web to ONE desktop by using metadata reader steps and some condition steps to achieve this. Please refer the document how to use those and let me know if you still need any more guidance on how to proceed here.
Hope this helps !
Regards,
Srija Piratla
Hi @Radziah ,
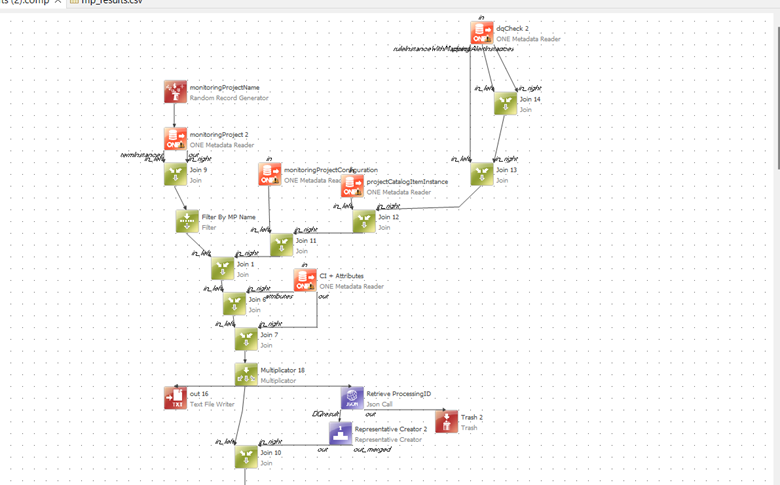
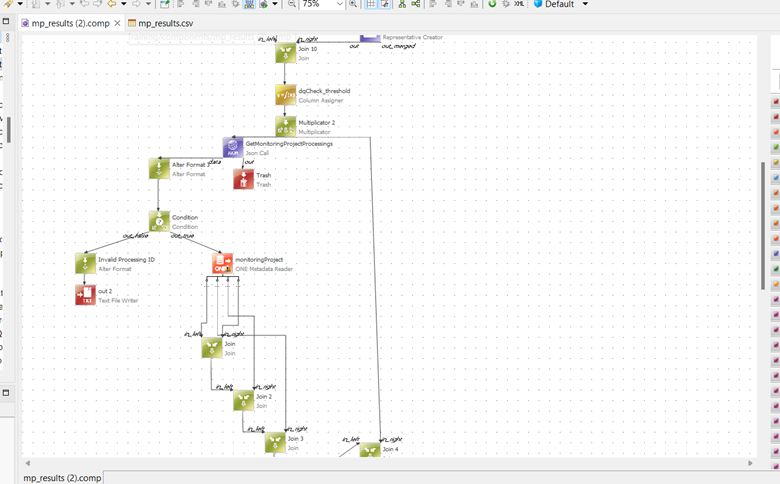
To export the monitoring project results from one web. In one web we can check if the dq checks we applied are valid or invalid. To achieve this we can use this plan and get the results.
Hope this helps to move forward ! I’ll share the detail documentation on this export plan once I’ve it ready on how to create this.
Regards,
Srija Piratla
Hi Srija, thanks for this suggestion. The whole plan you shared seems quite complicated for me to understand. Additional information I may share, we don’t have the rules defined and DQ checks done on the ONE Web, instead, we are using the column assigner to define the rules since we are comparing several fields from two data sources.
I noticed an option of Data Quality Indicator since they have summary output. Will it be useful for this case? Or there are several other steps that may be helpful. Thanks in advance!
Hi @Radziah ,
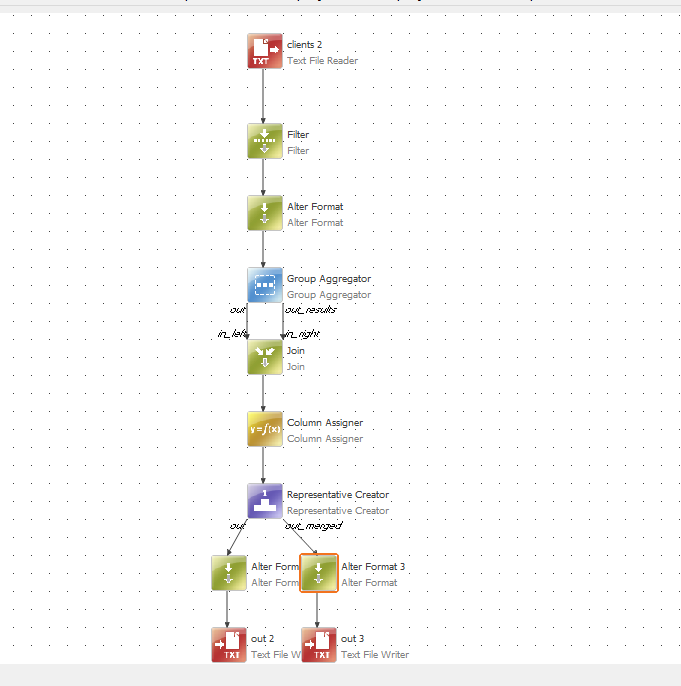
I took a sample data and tried to use that to get some valid and invalid records.
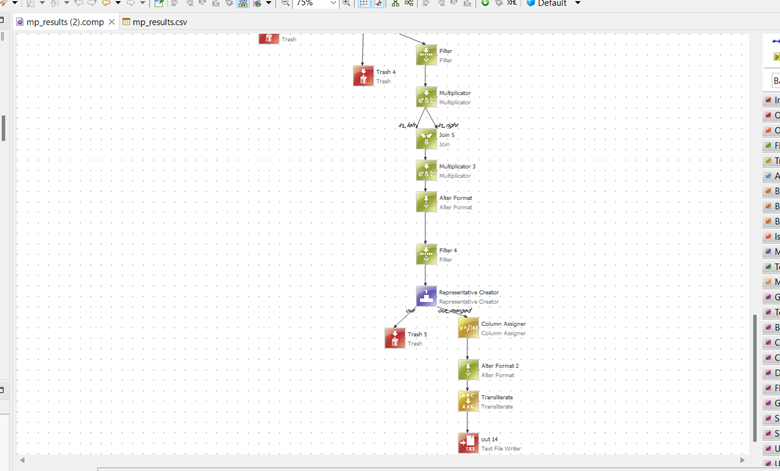
Then used the group aggregator step to get the total records - This step is used to aggregate data based on specific grouping criteria within a data processing pipeline. This step allows you to group records together based on one or more attributes and then perform aggregation functions on the grouped data. Common aggregation functions include sum, average, count, minimum, maximum, etc.
Join step - To join with the main data and total record count
Column assigner - DQ check - here is used on the first name - case(trashNonLetters(first_name) <> first_name, 'INVALID','VALID')
Representative creator - Grouped them to get the number of valid and invalid records
Alter step - Percentage count - (DQ_Name_check_count/total_count)*100
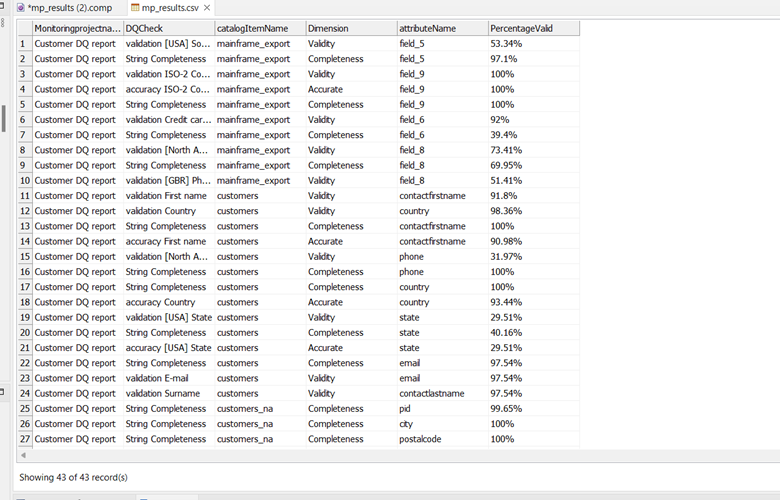
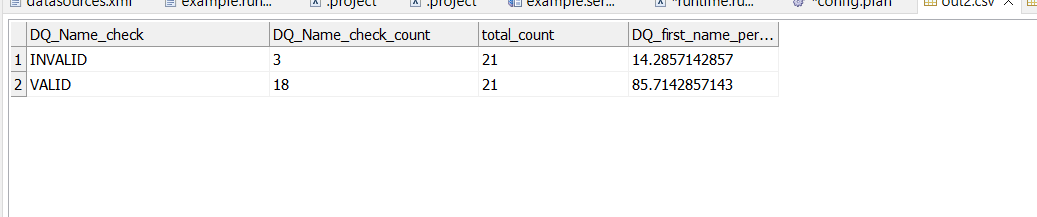
Here is the plan and the final output. Hope this helps. If you want the detailed output for what you are looking, please provide the plan you are using.
Regards,
Srija Piratla
Hi Srija
Thanks for this plan, the reason why you’re using the group aggregator is because you will use to calculate total records of the breaking rules? I am interested to know the detailed configurations inside each step especially the Group Aggregator and Representative Creator. Do you mind sharing the plan with me so that I could try on my end on how can I implement it to my existing plan.
Hi @Radziah ,
Please find the attached plan and let me know if you need anything here.
Regards,
Srija Piratla
Hi @Radziah, I’m closing this thread for now, if you have any follow-up questions please feel free to share them in the comments or create a new post ♀️
Hi @srija piratla
May I know why do you have two different alter format and output after the Representative Creator step?
additionally @srija piratla if we have multiple rules and multiple columns are involved in the rule, do we expect to have more “Dummy” column created as total counts? My understanding is we don’t have to but instead, we should add more calculations on the Step Representative Creator.
Hi @Radziah ,
In the above plan, We have Out 2 and Out 3.
Out 2 - Gives the percentage value of Invalid and Valid along with all the attributes so that it will be easy to have all the columns at one place. Out 3 - Will give a summary of different rules, respective count, total count, respective percentage count.
The Dummy column is created to extract the total count of records irrespective of DQ rules. Lets say excel has 100 rows then we are using a dummy column and assigning it as '1' to extract the number of rows that we have in excel using a group aggregator by calculating the sum/count of 1's we have.
If we use representative creator to extract the total count then the groups that we consider for differentiating multiple dq rules will have total count of the respective dq rule instead of total count of records.
This is an example plan and you can customize it based on your needs.

 ♀️
♀️