Hi Ataccama community,

I’m hoping someone with better grip on the Ataccama GraphQL model can shine a light on this. 

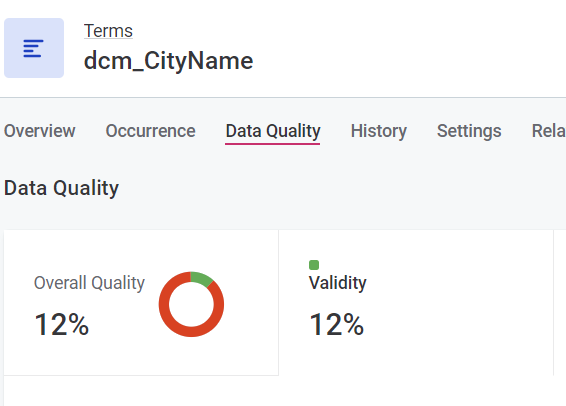
For internal reporting, we are looking to retrieve data quality details via the Ataccama GraphQL API. One of the requests it to produce an overview of the DQ score across the (rule’s) DQ dimensions. This is basically the same as is shown in the web UI when navigating to the ‘Data Quality’ tab for a Term. It shows the score broken down by dimensions, based on how the rules are defined.

What I’m trying to do is retrieve the passed/failed rows at this level, so for each term and each dimension. This would allow me to summarise this into a score per dimension.

However,  I am unable to get this out of the API.

I’ve approached this from both the ‘terms’ and ‘rules’ pathway. In both approaches I always end up with the ‘Overall Quality’ score for each term - not the per dimension details.

The ‘rules’ query looks promising, but ultimately only returns the passed/failed records for the overall quality score, not specifically the rule that applies (for example the accuracy rule).

For reference, this is the attempt starting from the (list of) rules:

query listRules {
rules (versionSelector: {draftVersion: true} filter: "implementation.$type =='ruleDqImplementation'") {
edges {
node {
gid
publishedVersion {
name
ruleDefinitionSource
#description
implementation {
gid
#type
publishedVersion {
aggregationRule
component
dqDimension {
publishedVersion {
name
}
}
}
}
termInstances {
edges {
node {
gid
publishedVersion {
displayName
target
{
gid
publishedVersion {
name
dqEvalTermAggr {
storedVersion {
ruleCount
recordCount
invalidCount
validCount
}
}
}
}
}
}
}
}
}
}
}
}
}

And this is the attempt starting from the list of term, trying to find out what rules apply and ideally retrieving the scores from there:

query listGlossaryTerms {
terms(versionSelector: { draftVersion: false }) {
edges { # List of terms
node{
gid
publishedVersion { # Individual term
name
dqEvalTermAggr {
storedVersion {
ruleCount
recordCount
invalidCount
validCount
}
}
validationRules {
publishedVersion {
enabled
ruleInstances { #listwrapper (list of rules)
edges {
node { #nodewrapper
gid
nodePath
storedVersion { # individual rule
displayName
}
}
}
}
}
}
stewardship {
gid
nodePath
type
draftVersion {
name
}
}
}
}
}
}
}

Does anyone know which route to take to find the scores per dimension? By looking at the page setup there seems to be a dqEvalTermOverview object that contains this, but I don’t know how to access this via GraphQL.

An update, because there is so little to find about this. Not 100% what I’m looking for, but with the help of Ataccama support I ended up with this one:

query listGlossaryTerms {
terms(versionSelector: { draftVersion: false }) {
edges { # List of terms
node{
gid
publishedVersion { # Individual term
name
dqEvalTermAggr {
storedVersion {
ruleCount
recordCount
invalidCount
validCount
}
}
validationRules {
publishedVersion {
enabled
ruleInstances { #listwrapper (list of rules)
edges {
node { #nodewrapper
gid
nodePath
storedVersion { # individual rule
displayName
}
}
}
}
}
}
stewardship {
gid
nodePath
type
draftVersion {
name
}
}
dimensionAggregationResults {
dimensionId
attributeCount
catalogItemCount
totalCount
ruleInstanceCount
results {
id
name
count
}
}
}
}
}
}
}

This way, the dimension id can be cast as the name - but I haven’t found a way to get the name returned straight away.


Hi @RoelantVos, welcome to the community and thank you for posting & sharing the solution. I’ve just pinned the post to see if there are any community members who can offer some ideas here 🧠


Hello!

Thanks for your patience on this one.

Just so I understand correctly, the end goal here is to provide a % pass/fail metric for a full dimension? So just like the below image where we aggregate for a single term, but aggregating against all evaluated rules? (And the above queries being a way of getting this via terms?) 


If so, I’ve spent a few hours looking into this for you, and introspecting the graphQL schema behind the scenes.


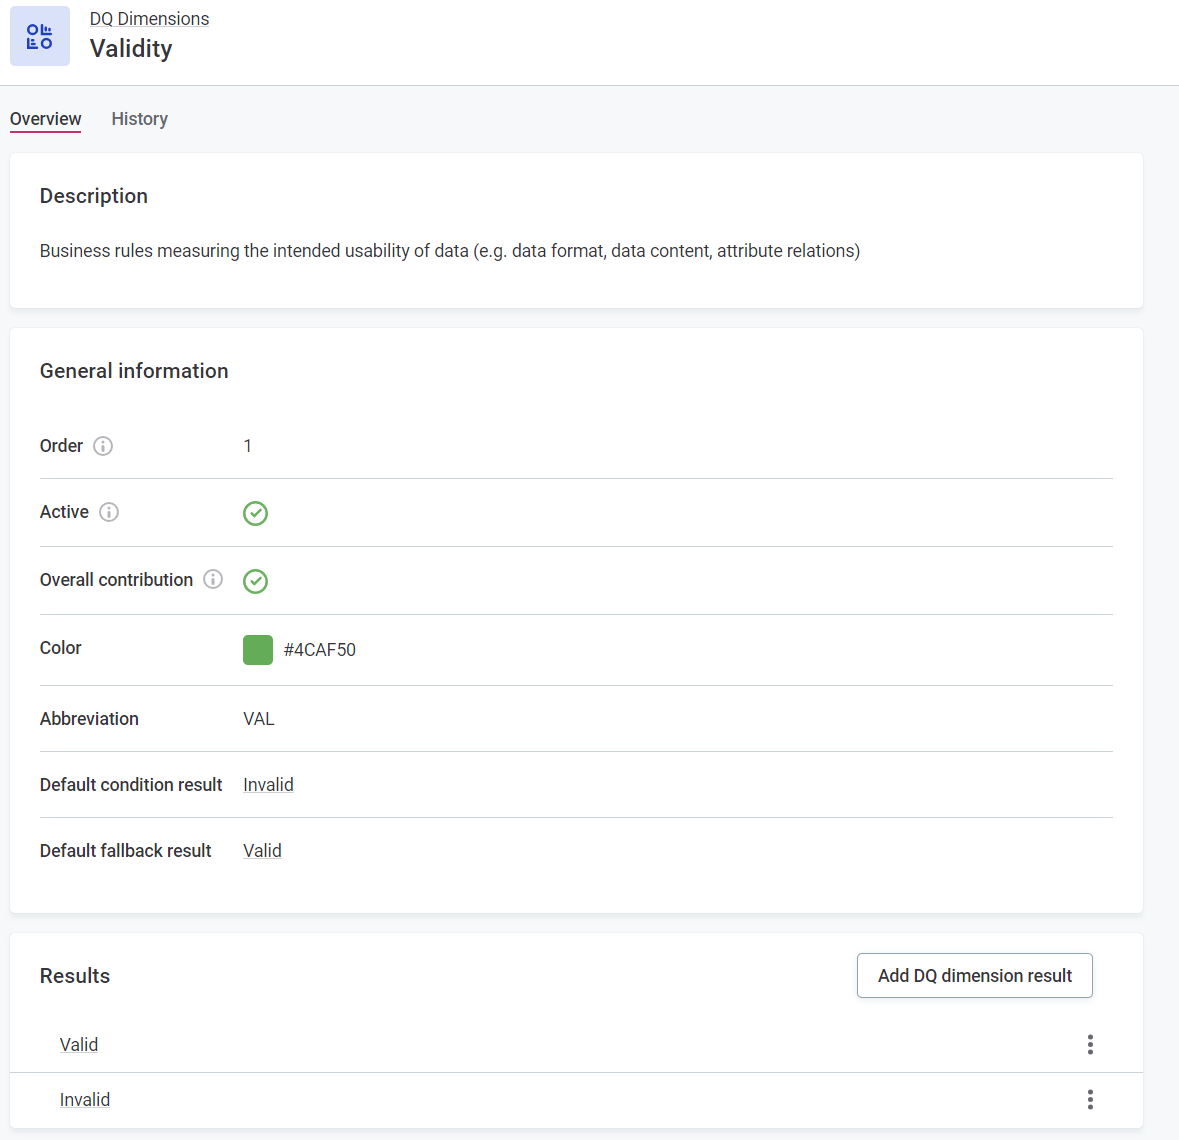
First thing’s first - unfortunately we do not hold anywhere in the platform/GraphQL schema aggregations for each dimension against all rules/terms. This is why if you look at the respective dimension page, there is no widget showing aggregations


Secondly, going via terms in the above queries will likely result in an inaccurate calculation. This is as there are two pathways to mapping rules; via terms, and direct to the catalog. It is therefore likely that information will be missed out of the calculations.


So what is the best way to proceed? While we do not directly store this data in the product, it is technically possible for you to derive it yourself. You would go down the route of getting dimension aggregations against each catalog item, and then weighting by the number of rows in the catalog item (which you would get from profiling results). How you do this will depend on how you map rules in Ataccama.

  1. If you map rules in Monitoring Projects, you would extract the aggregations for each Catalog Item from the “Report” section in a Monitoring Project. Your path through the metadata model in the query would basically be Catalog Item → Aggregation Stats + Profiling
  2. If you map rules directly to a catalog item, you would extract the aggregations from the “Data Quality” section of a Catalog Item. (You may also need some additional filtering to account for duplicate CIs across multiple MPs). Your path through the metadata model in the query would basically be Monitoring Project → Catalog Items Aggregation Stats + Catalog Item → Profiling 

You can get the profiling results with 

query getAllProfiling {
catalogItems(versionSelector: { publishedVersion: true } size: 10 skip: 0) {
edges {
node {
publishedVersion {
name
profilingConfigurationInstances {
edges {
node {
publishedVersion {
profiles(
size: 1
orderBy: { property: "profiledAt", direction: DESC }
) {
edges {
node {
publishedVersion {
profiledAt
attributeProfiles {
edges {
node {
publishedVersion {
displayName
attribute {
publishedVersion {
dataType
termInstances {
edges {
node {
publishedVersion {
displayName
}
}
}
}
}
}
anomalyState {
publishedVersion {
state
}
}
attributeProfileData {
publishedVersion {
distinctCount
duplicateCount
frequencyCount
frequencyGroupsCount
masksCount
minValue
maxValue
nonUniqueCount
nullCount
numMin
numMean
numMax
numStdDeviation
numSum
numVariance
patternsCount
stringMinLength
stringMeanLength
stringMaxLength
totalCount
uniqueCount
frequencyGroupsHead(
orderBy: {
property: "count"
direction: DESC
}
size: 3
) {
edges {
node {
publishedVersion {
value
count
}
}
}
}
masksHead(
orderBy: {
property: "count"
direction: DESC
}
size: 3
) {
edges {
node {
publishedVersion {
value
count
}
}
}
}
patternsHead(
orderBy: {
property: "count"
direction: DESC
}
size: 3
) {
edges {
node {
publishedVersion {
value
count
}
}
}
}
quantiles(
orderBy: {
property: "percentile"
direction: DESC
}
size: 3
) {
edges {
node {
publishedVersion {
value
percentile
}
}
}
}
}
}
}
}
}
}
}
}
}
}
}
}
}
}
}
}
}
}
}


That is for the short term... in the long term, I can pass on the suggestion to provide this aggregation directly in the product. Would you be able to share a bit on your use case and the reasons for wanting to see results aggregated to a dimension level? I will share it with our product team.


Best of luck!

Oli


Reply