
Happy Tuesday community!
Today we are continuing with the Monitoring Projects functionalities. What’s on the menu? Reports!
We'll walk you through the essential features and insights you can gain from DQ (Data Quality) Reports in this post, helping you keep a close eye on the health of your data.
Overview of DQ Reports
DQ Reports display the DQ results and detected anomalies over time for all monitoring runs. They offer a comprehensive view of issues and statistics, allowing you to track changes in DQ across the entire monitoring project, catalog items, specific DQ dimensions, and checks assigned to attributes.
As a DQ Steward, you'll be notified whenever a new report is available and have the ability to explore DQ issues and anomalies in greater detail.
Viewing the Report
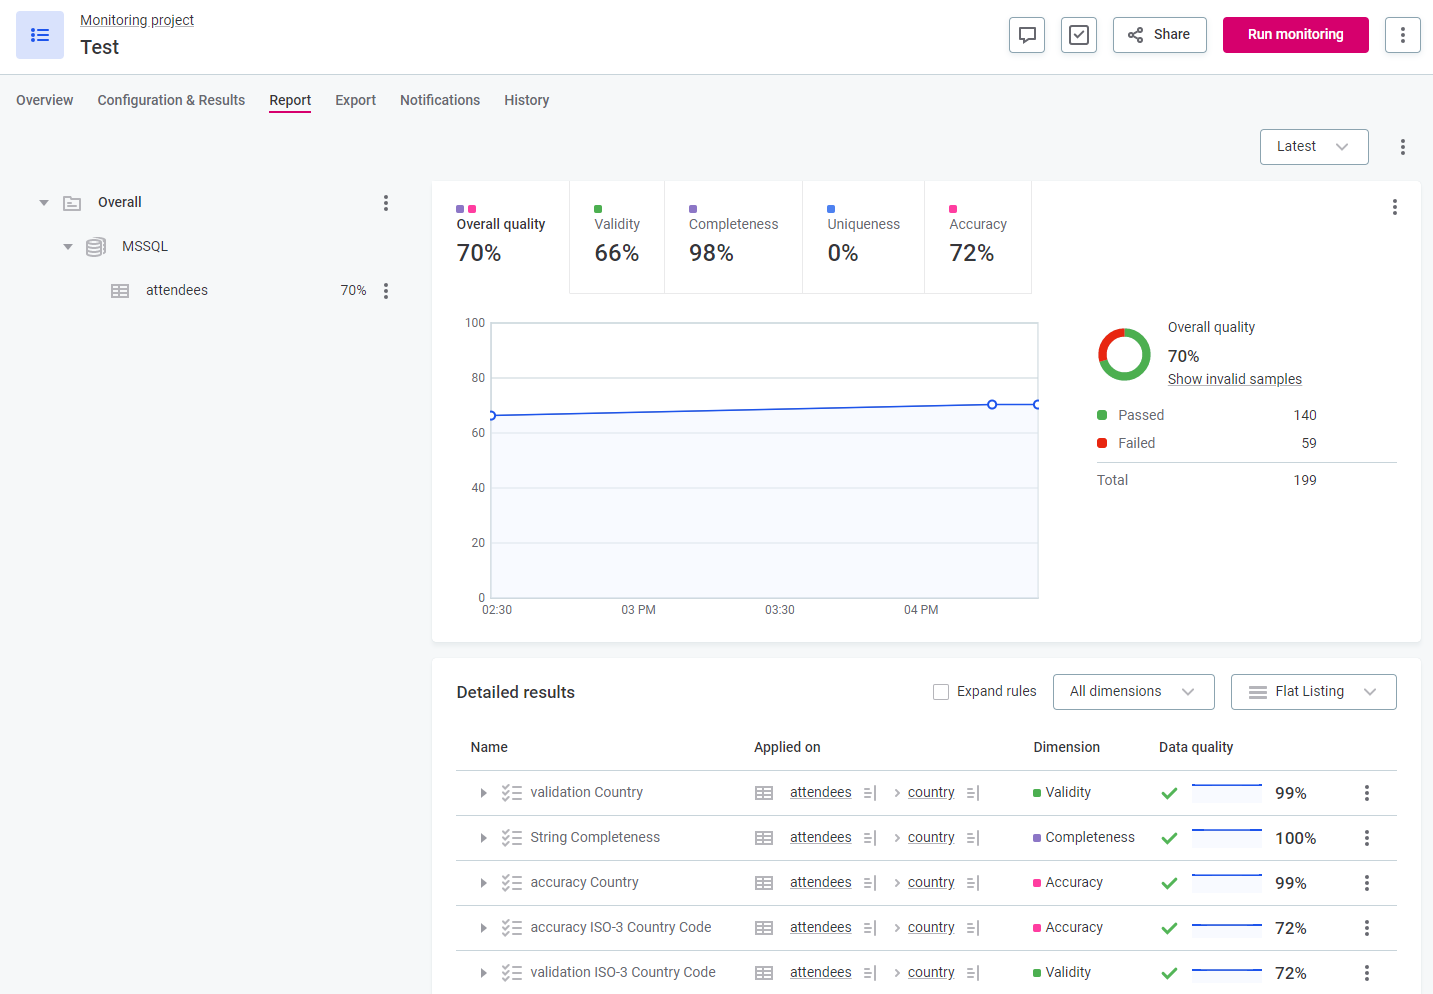
Once monitoring is complete, you can access the Data Quality results in the Report tab of your project. The report provides different levels of granularity:
- Overall: A high-level summary of the entire monitoring project.
- Source: Results for specific data sources.
- Catalog Item: Detailed results for individual catalog items.
- Custom Sections: Custom-created sections for specific insights.
If you have restricted access to certain data, the report will show results relevant to your subset.
Understanding Issues and Anomalies
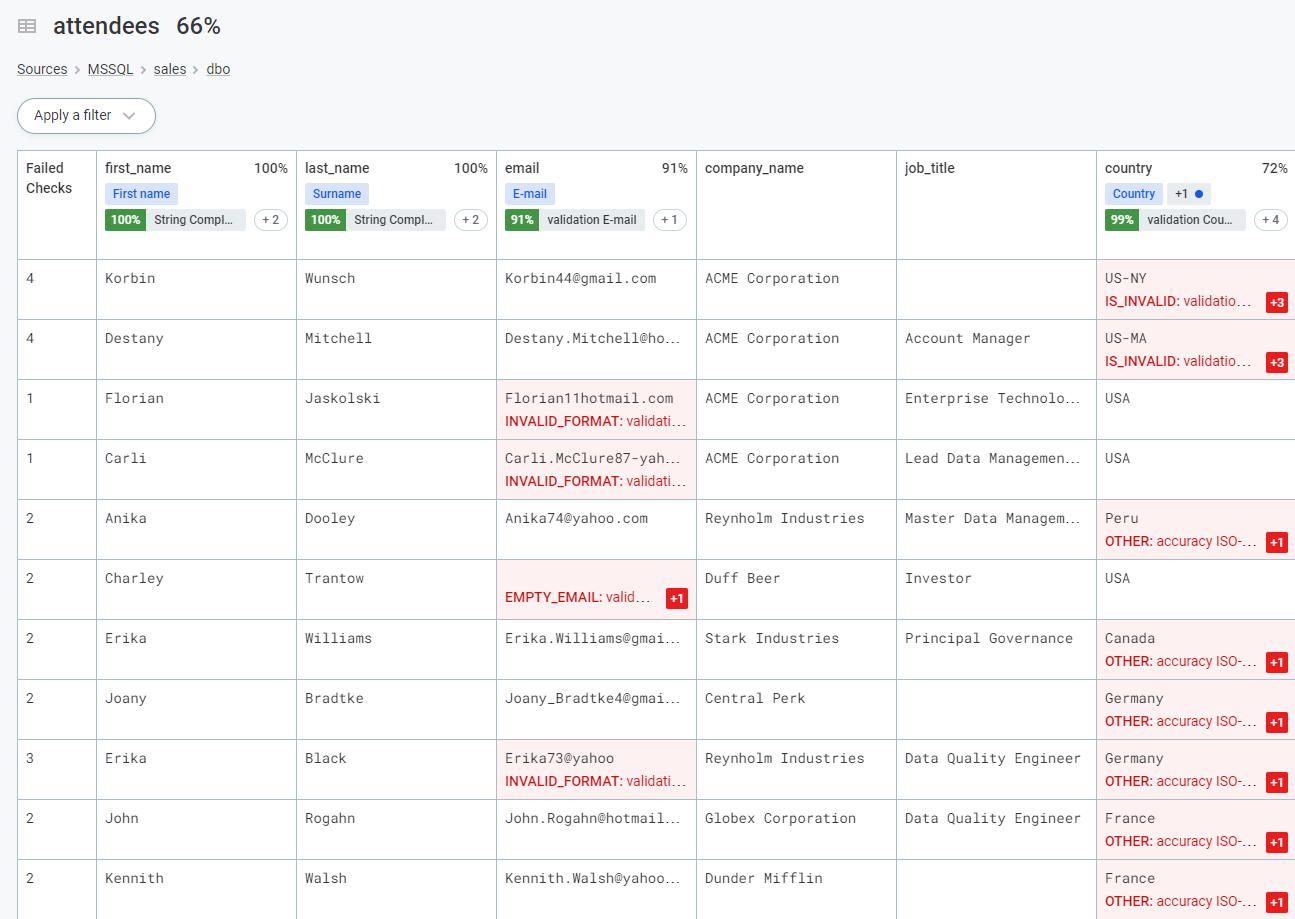
In the report, the icon alerts you to any issues detected. Hover over the icon to see more details. You can also interact with the DQ graph by hovering over marked events to see the DQ percentage and timestamp. To explore invalid results in detail, click on Show invalid samples to view problematic values and the associated failed checks.
Adjust the report view by applying filters to specific attributes, checks, or data quality dimensions using the Apply a Filter option.
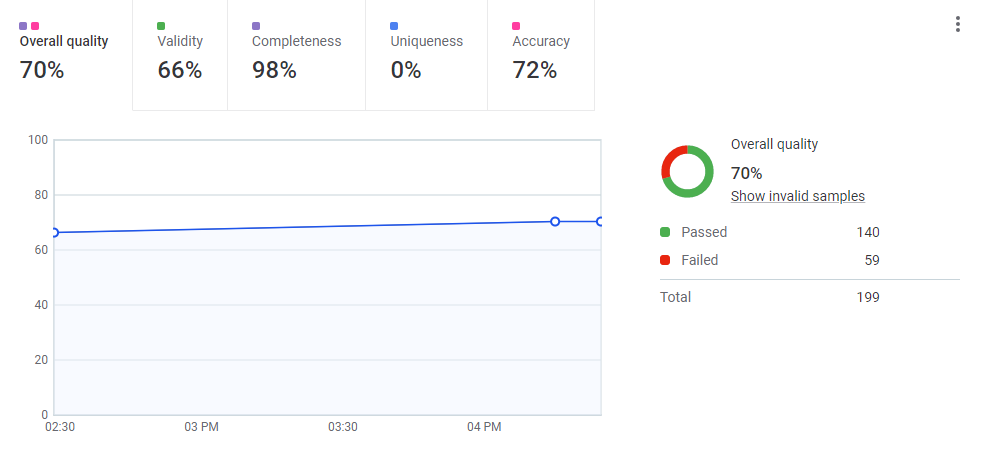
DQ Dimensions and Overall Quality
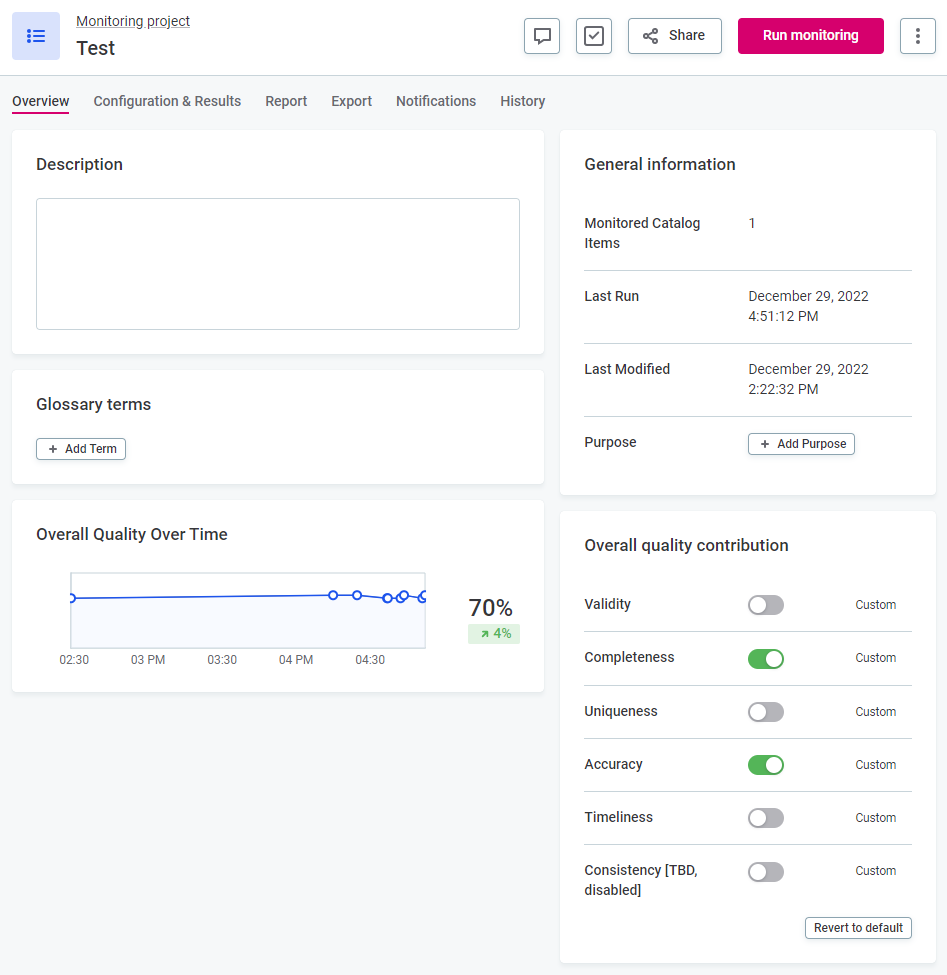
The report offers aggregated DQ results in the Overall quality tab or for specific dimensions. Different colors in the Overall quality tab indicate contributing DQ dimensions. These can be verified by hovering over the tab or checking the DQ dimension configuration in the monitoring project overview.
Note: The overall quality percentage will be equal to or smaller than any contributing dimensions' pass/fail percentage.
Grouping and Organizing Results
At each level of the report, you can choose to group results differently:
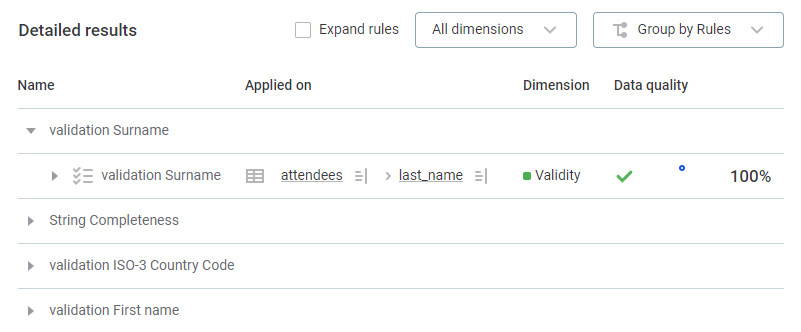
- Group by Rules: Attributes grouped under relevant rules.
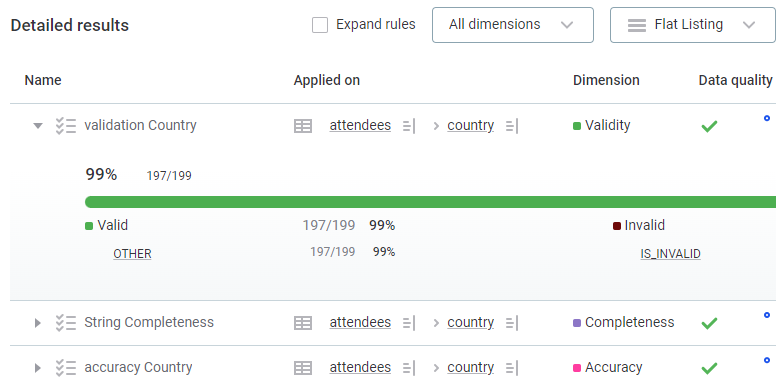
- Flat Listing: A list of rules and attributes without grouping.
- Group by Attributes: Within a catalog item, group results by attributes.
Expanding the rules in the Detailed results list lets you see the data quality for all rules used in the monitoring project. Clicking on a rule reveals its Overview and Implementation tabs, where you can make modifications and publish changes.
Single Rule Overview
For a focused view of data quality over time for a single rule:
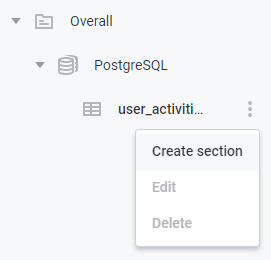
- Select Create Section from the more options menu for a Catalog Item.
- Specify a name for the section and choose from the available rules.
- Click Create or use the dropdown to select Save and Create Another.
Checking for Anomalies
To identify anomalies in the DQ Report:
- On the catalog item level, select Group by Attributes.
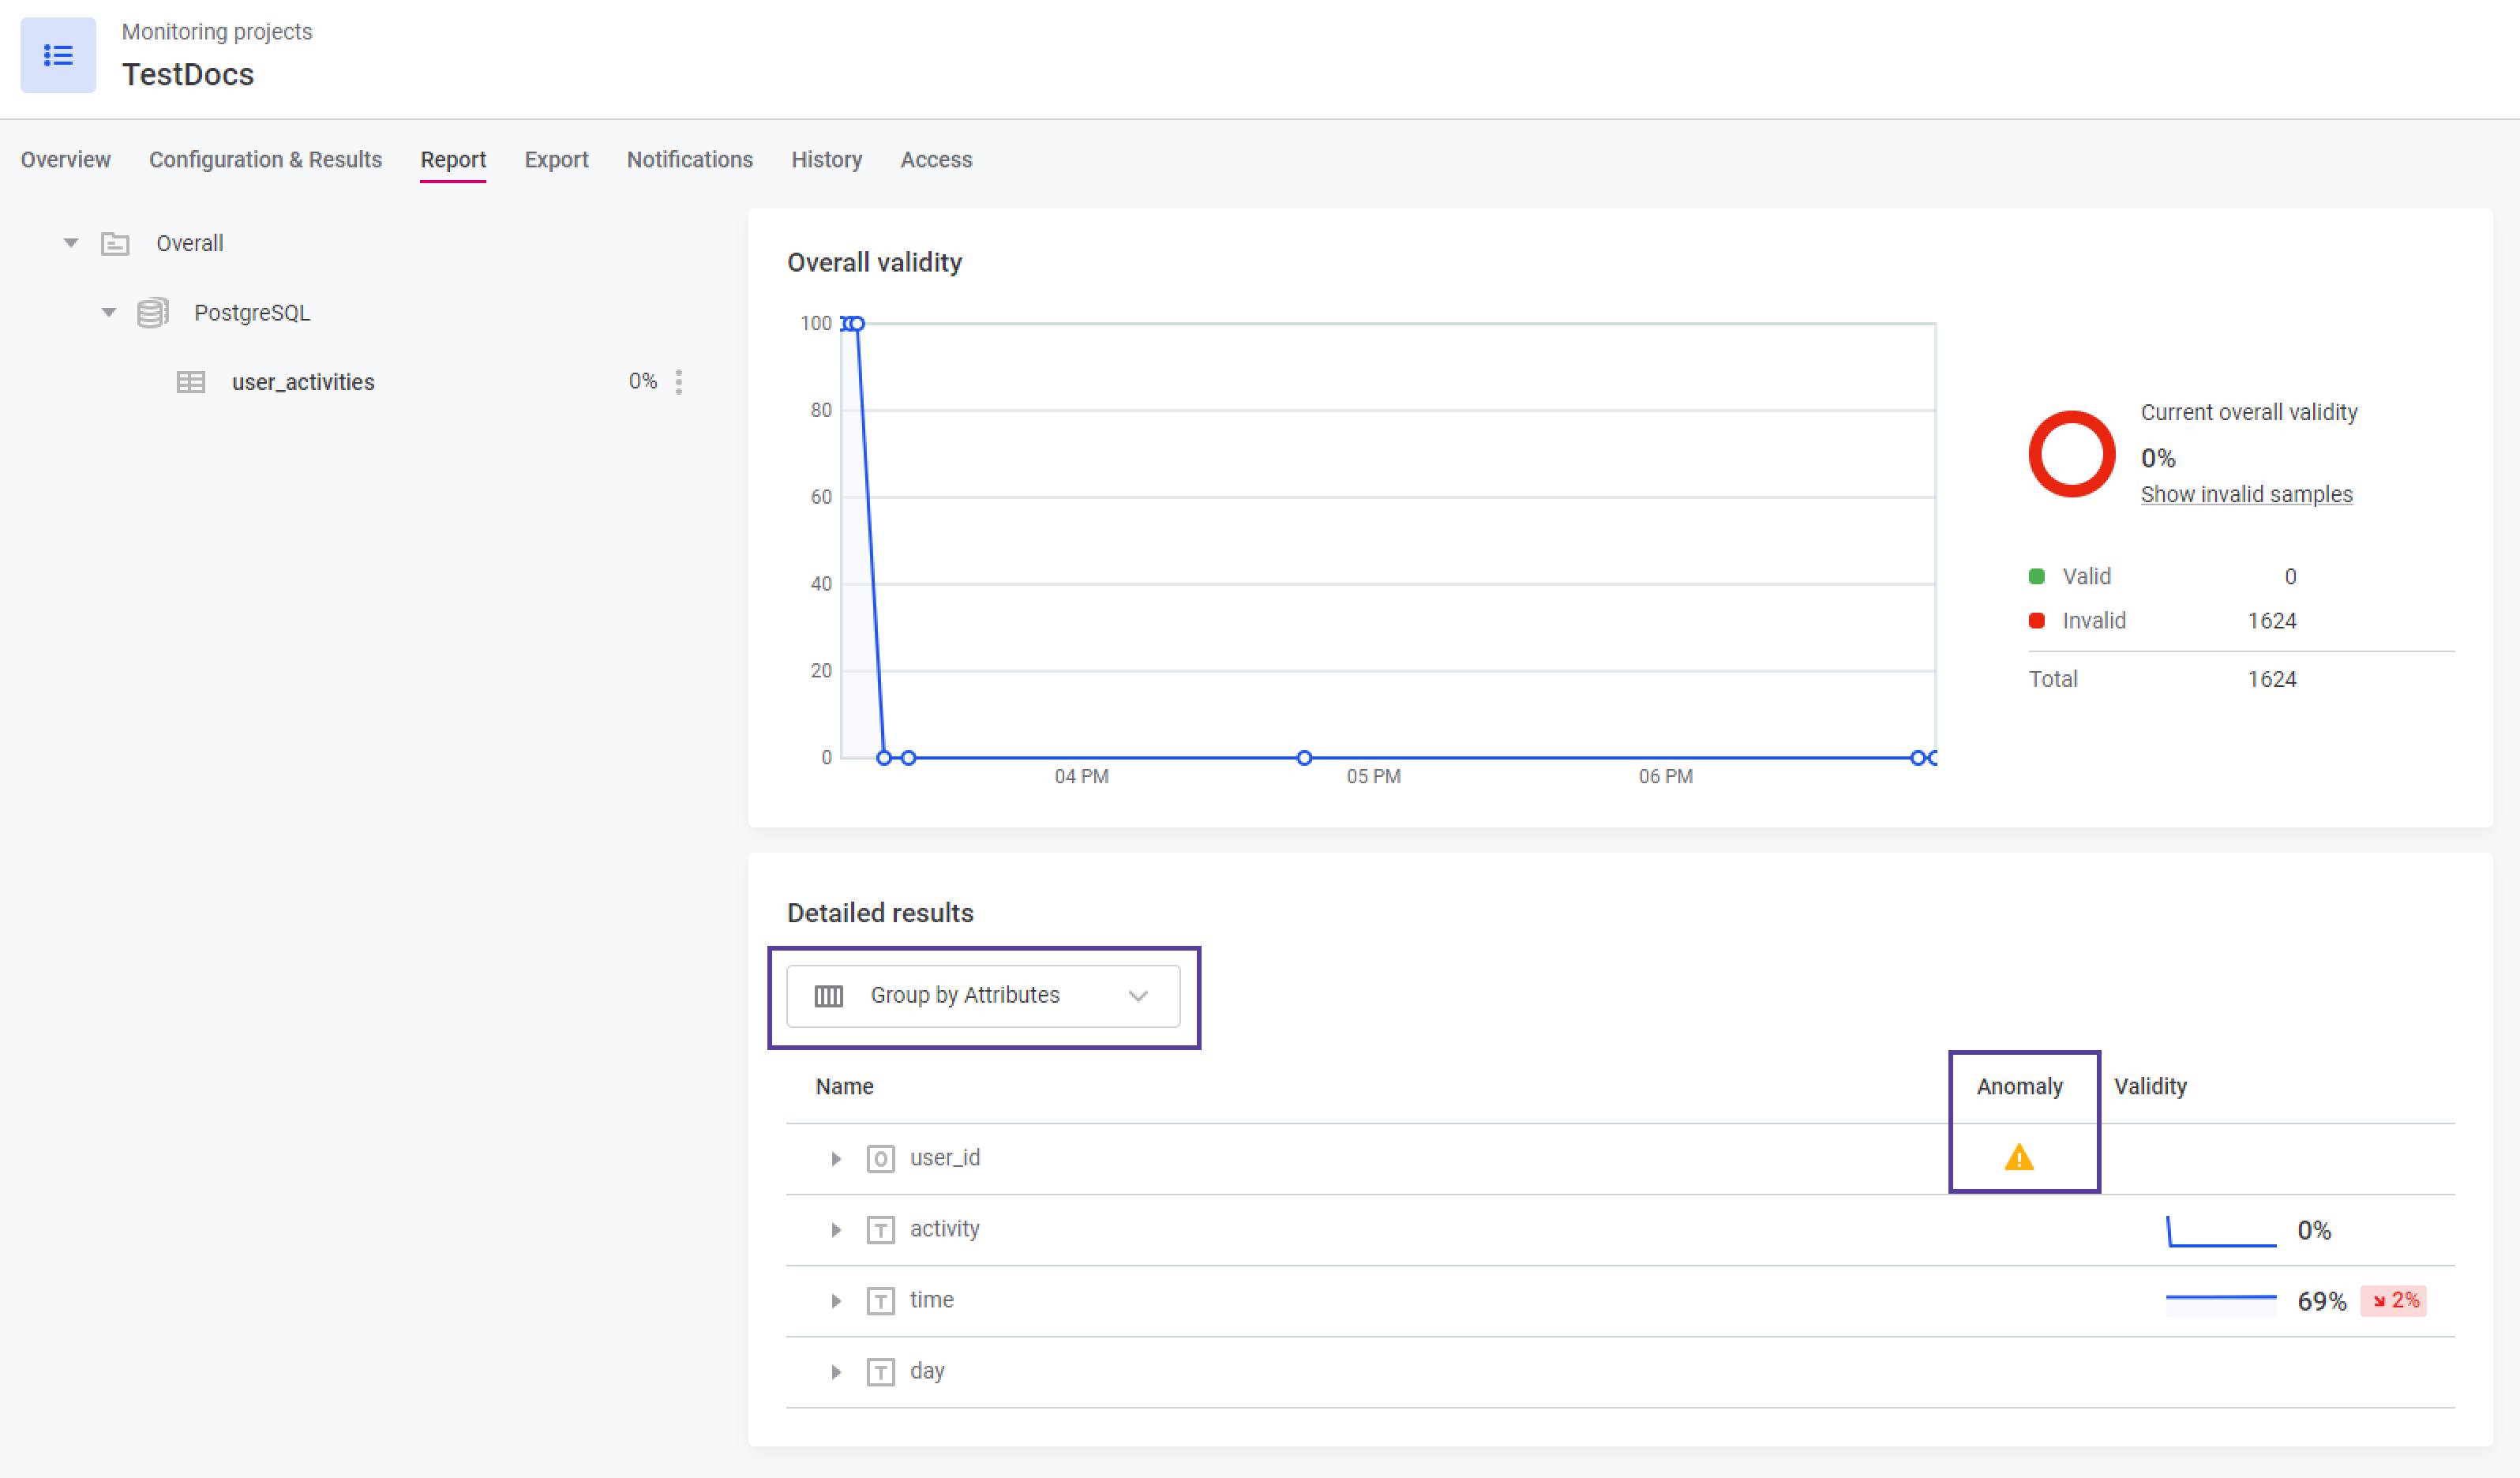
- The Anomaly column will be visible, highlighting any detected anomalies.
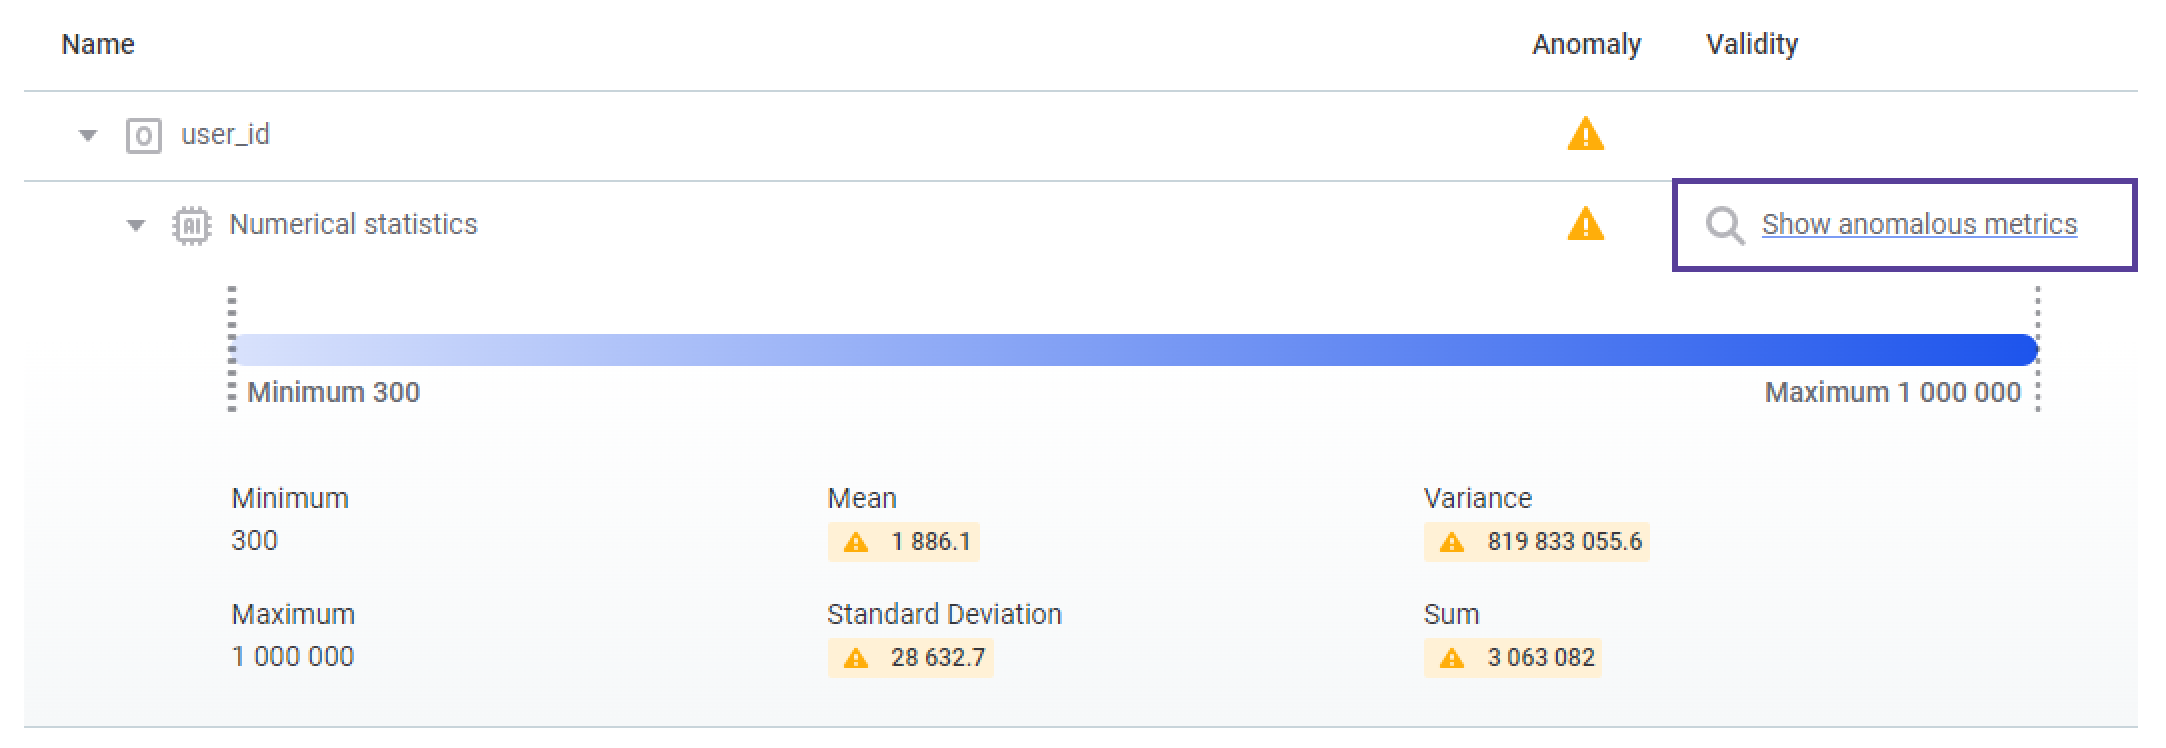
- Expand relevant rows for further details or select Show anomalous metrics to open the Profile Inspector.
Next up is Monitoring Project lifecycles, so keep an eye on the community!