At our site we have Ataccama on premise and several sources from different data systems. It happened a couple of times that profiling on one of the sources was no longer possible and that we found that out more than a week later. After which it was difficult to track back why this happened.
We do have monitoring of all kinds of Ataccama components with Prometheus. But that didn't seem to detect these issues. I was looking for a way to monitor profiling functionality.
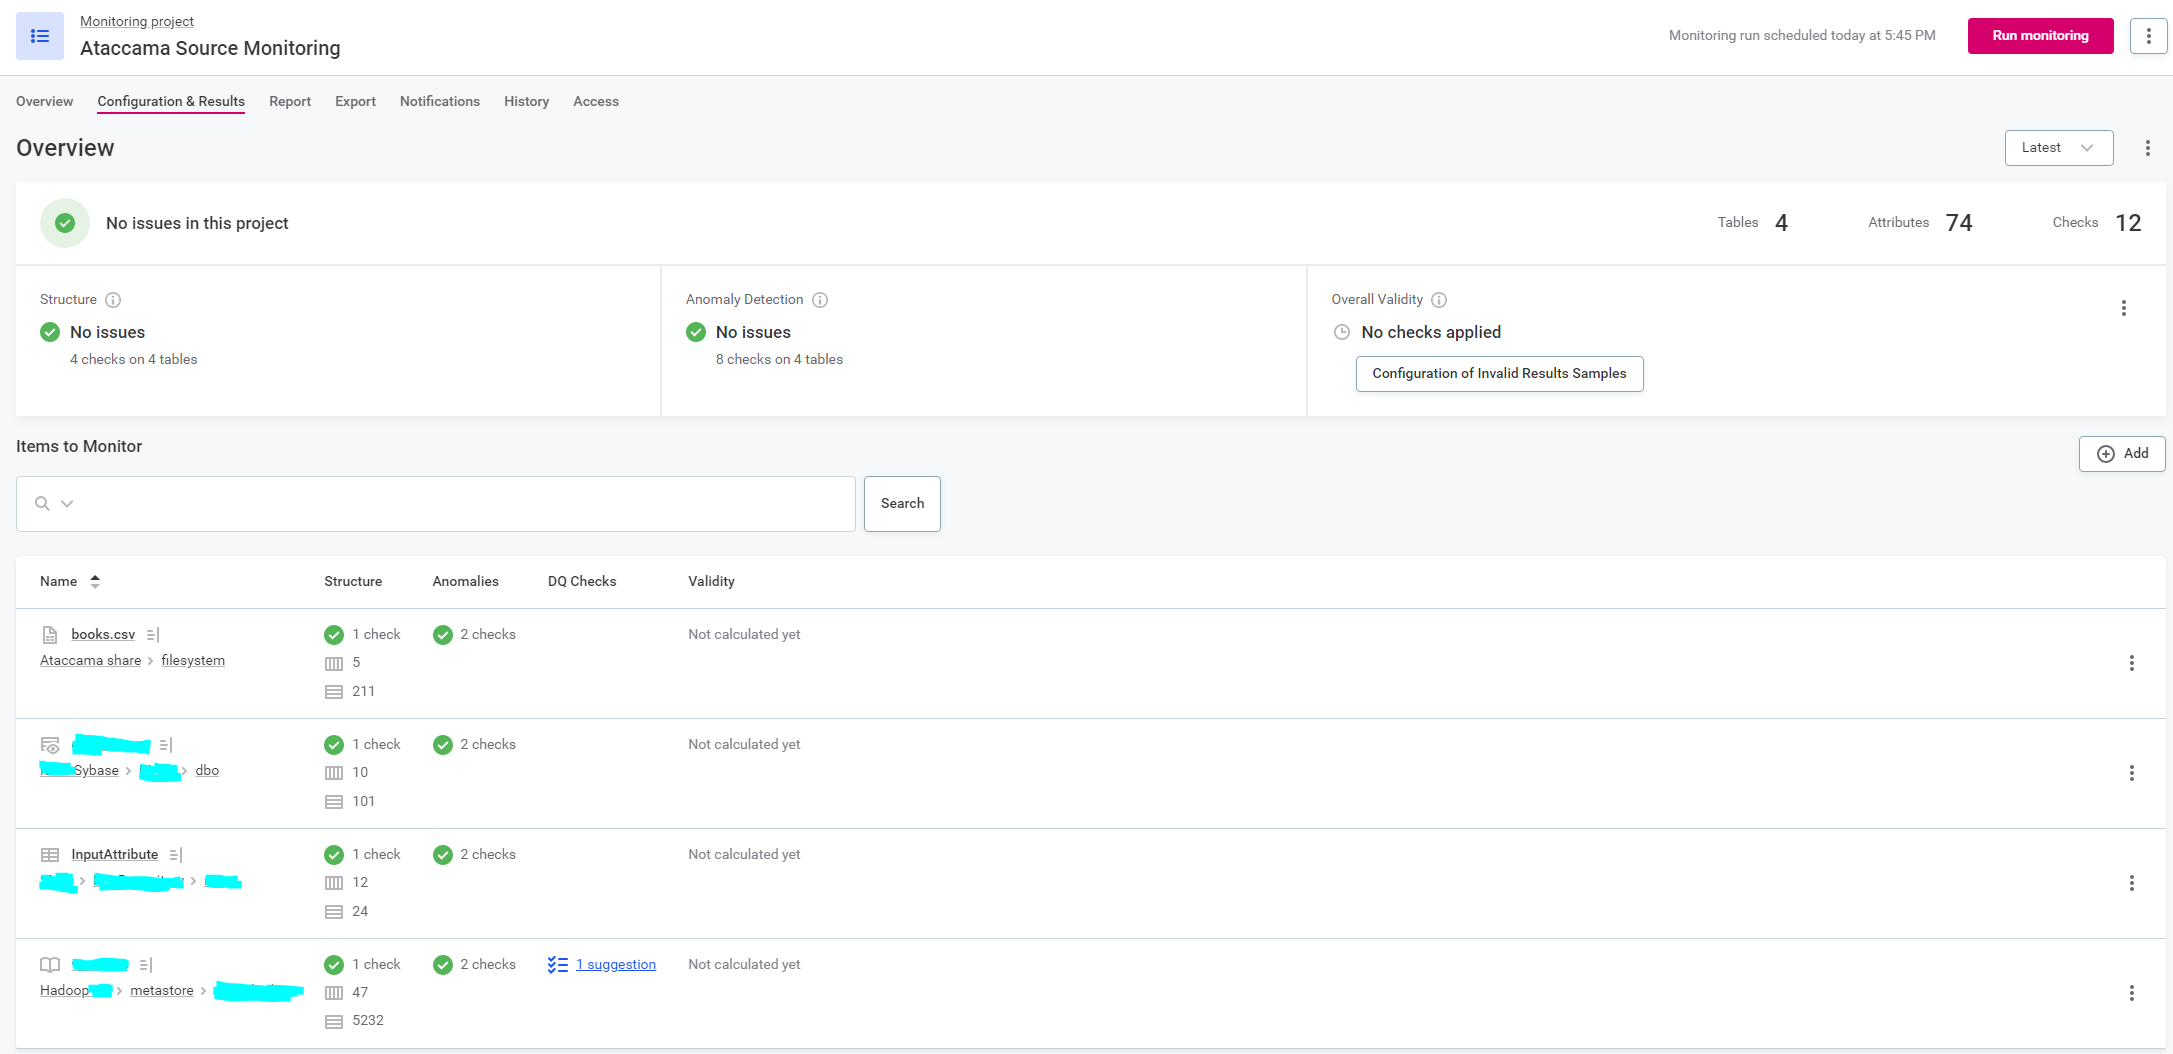
So what I came up with was a monitoring project that profiles a small table from each source, every hour.

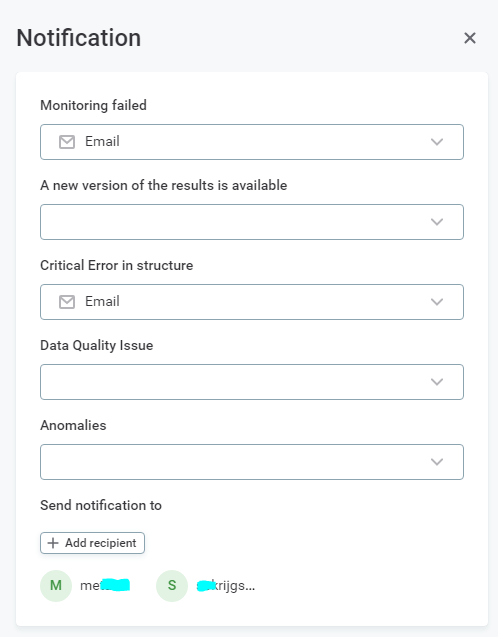
Since you can schedule a monitoring project every hour at least, and since you can add notification in case of failure, this gives us warning at most near 1 hours after something breaks.
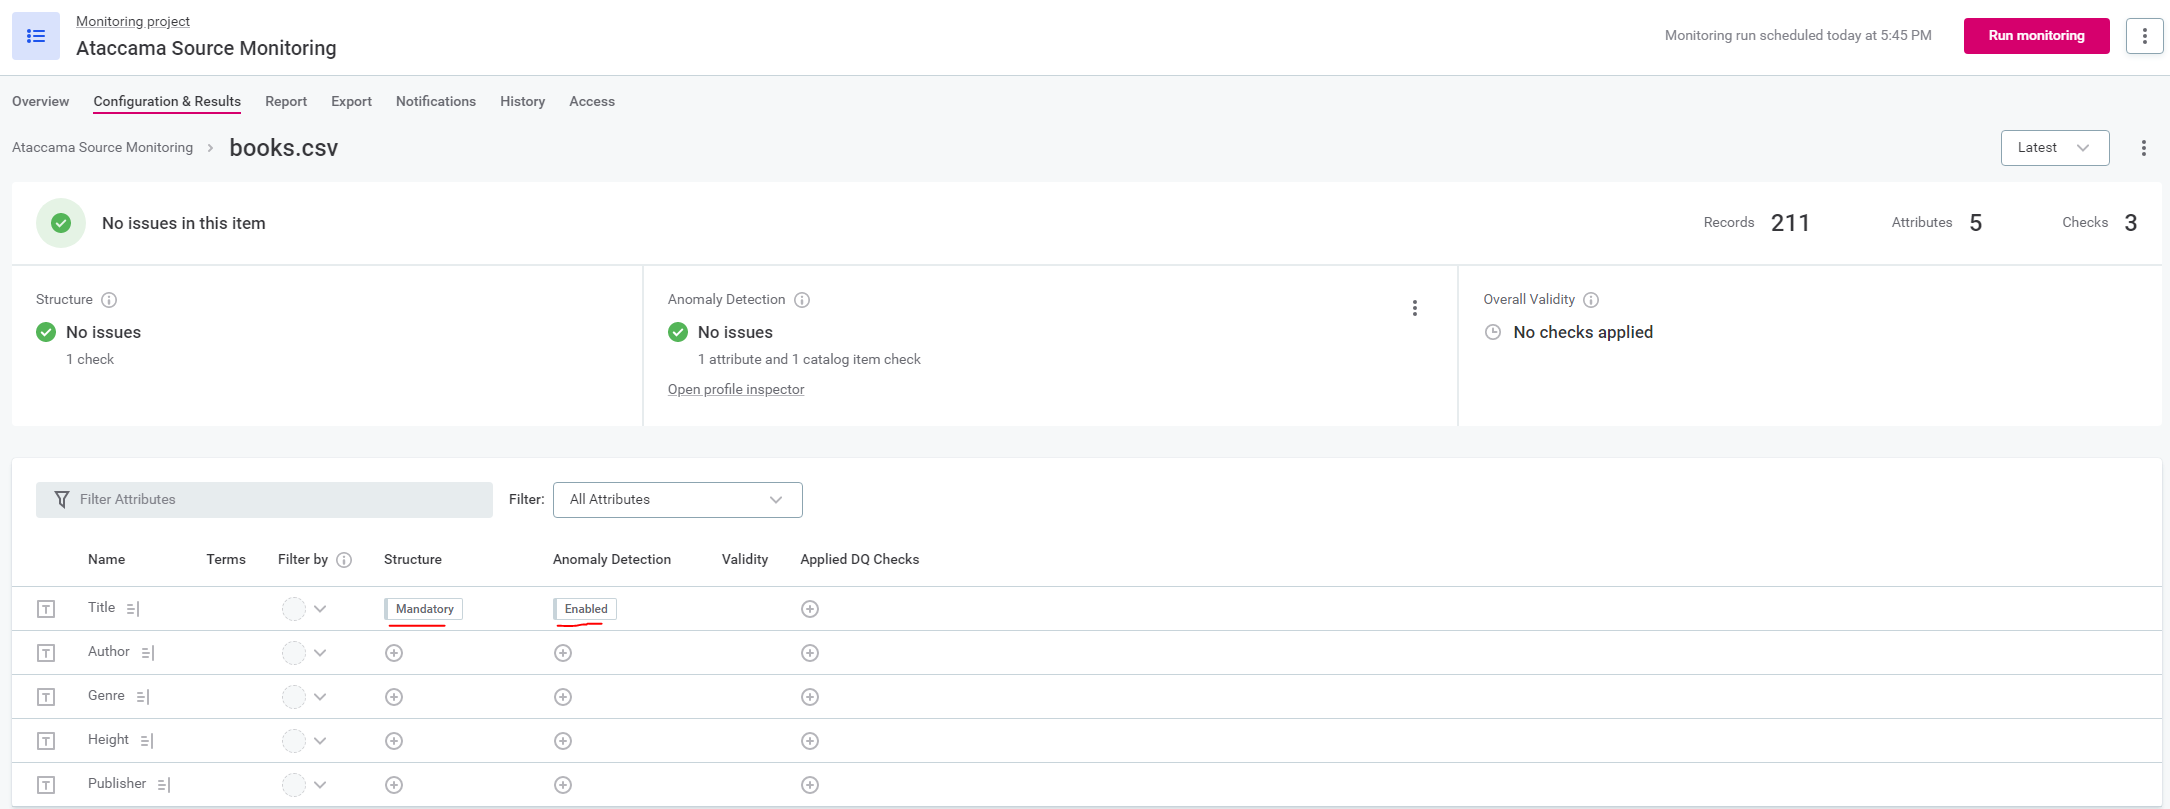
Just adding a catalog item of a table to the MP turned out not to be sufficient though. Because when the monitoring project ran, it did only a structure check, not a profile. To get it profiling, it needed an anomaly check.

When you do an anomaly check though, make sure the MP doesn't notify of actual anomalies. Unless you want to of course.

If you want, you can have even shorter monitoring intervals. In that case you need to use a GraphQL query to schedule the run and check of the monitoring project yourself from some other scheduling system.
For us this was a great improvement. Not just for timely alerts ("did you guys change something on Hadoop?, because we can't profile anymore since an hour ago". But also as a test after patching ("nobody leaves until the Ataccama Source MP is green again  ").
").

 Thank you for sharing your best practice, it’s a really good idea to have more control over your profiling!